Activity
Graphic Organizers
Est. Time: 30–40 Minutes
Objective
Understand how graphic organizers can help students organize information, process information, see the relationships between ideas, and more easily understand, remember, and apply information.
Overview
Many students, particularly those with learning disabilities (LDs) and attention deficit hyperactivity disorder (ADHD), have difficulty processing information. More specifically, they might have trouble connecting new ideas and concepts to their prior knowledge, identifying main ideas and important pieces of information, and ignoring irrelevant information. Graphic organizers—a visual aid designed to help students organize and comprehend substantial amounts of text and content information—can help these students more easily process information.
Although there are many kinds of graphic organizers, often students with LD and ADHD will use the same type of graphic organizer (e.g., web) for every situation. It is important for teachers to not only select those that will best convey the information and relationships they want their students to learn but to explicitly teach students how to use them.
Listed below are five categories of graphic organizers that each serve a different purpose. For each category, two variations are provided. Select the drop-down menus to learn more about each.
Cause and Effect
Cause-and-effect chain: Students can use this type of graphic organizer to clarify the relationship between specific events and their corresponding outcomes, thus illustrating the concepts of consequences, inevitability, and causality.
with Juliet
from Verona
Juliet to be dead
Problem-and-solution map: Obstacles, hindrances, and malfunctions often have several possible solutions, and this type of graphic organizer can be an effective way to help students better visualize which solution will be the most effective.
Cause
Longer than usual period without rain
Cause
Longer than usual period without rain
Problem
Citywide water supply shortage
- Fine residents for overuse of water
- Purchase water from neighboring states
- Offer subsidies to farms and industry to limit water use
- Create program to encourage homeowners to use water more responsibly
Classifying
Students can use a web to categorize or classify items.
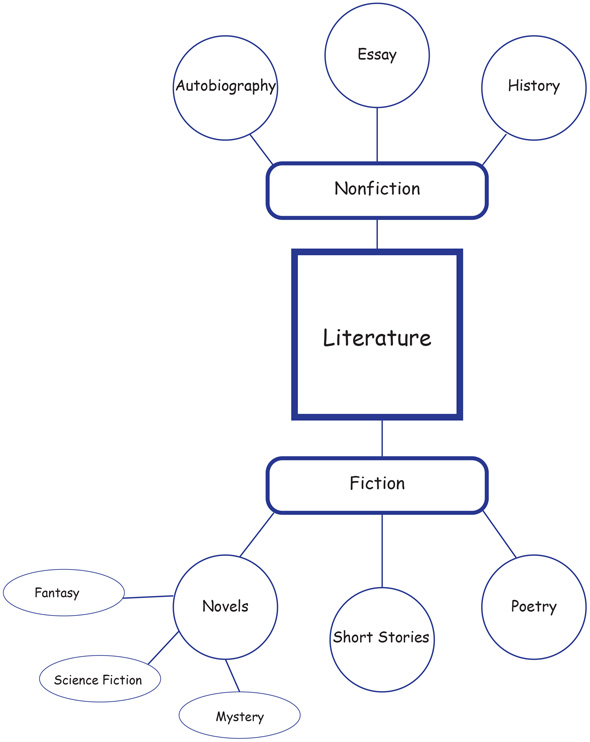
In this web graphic organizer, the central term “literature” is divided into a pair of major categories: “fiction” and “nonfiction.” These categories, in turn, are broken into more specific units. “Nonfiction” leads to “autobiography,” “essay,” and “history.” “Fiction,” meanwhile, spreads out to “novels,” “short stories,” and “poetry.” The term “novels” becomes more specific yet, breaking down to genre categories like “fantasy,” “science fiction,” and “mystery.”
Students can use this simple organizer to sort or classify information or objects into different categories.
| Types of Rocks with Examples | ||
| Igneous | Sedimentary | Metamorphic |
| Obsidian Basalt Pumice Granite Mica Quartz |
Sandstone Shale Fossils Limestone Gypsum |
Slate Marble Quartzite Schist Gneiss |
Comparing and Contrasting
Named after their creator, Venn diagrams are a type of graphic organizer used to show the overlapping relationships between various categories of ideas, things, events, mathematical expressions, or logical concepts.
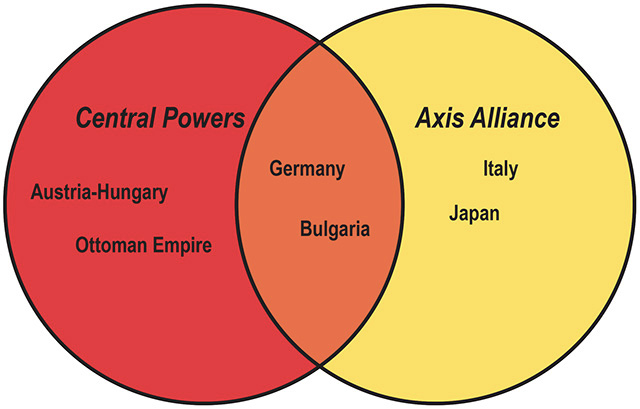
This Venn diagram depicts the primary nations that made up the Central Powers of World War I and the Axis alliance of World War II. The left circle features the Central Powers, including Austria-Hungary and the Ottoman Empire, while the right circle representing the Axis alliance includes Italy and Japan. The overlapping middle section includes Germany and Bulgaria.
Students can use this type of graphic organizer to clarify what is the same and what is different about the selected people, places, or objects.
| Attribute | Japan | China |
|---|---|---|
| Government | Unitary Parliament/ Constitutional Monarchy |
Single-Party State |
| Official Language |
Japanese | Mandarin |
| Population | 127 million | 1.35 billion |
| Geographic Location | Asia | Asia |
Describing
Word webs are graphic organizers that help students better understand a key vocabulary term by connecting it to related terms.
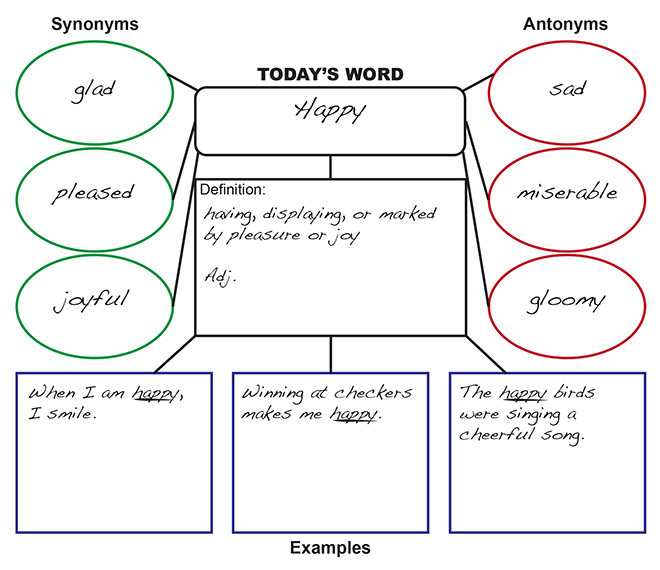
This vocabulary graphic organizer depicts different aspects of a word. In the center of the graphic organizer, Today’s Word is listed. Today’s Word is happy. Under the word is the definition of happy: “having, displaying, or marked by pleasure or joy, adjective.” Under the definition of happy are three examples of Today’s Word in sentences. The first example is “When I am happy, I smile.” The second example is “Winning at checkers makes me happy.” The third example is “The happy birds were singing a cheerful song.” To the left of Today’s Word are three synonyms for happy. The synonyms are glad, pleased, and joyful. To the right of Today’s Word are three antonyms for happy. The antonyms are sad, miserable, and gloomy.
This type of graphic organizer is used to help students develop more comprehensive vocabulary skills by offering a definition, characteristics, examples, and non-examples of a given person, place, event, or thing.
Sequencing
This simple and familiar type of graphic organizer arranges events in chronological order to help students better grasp the relationship between historical occurrences or developments.
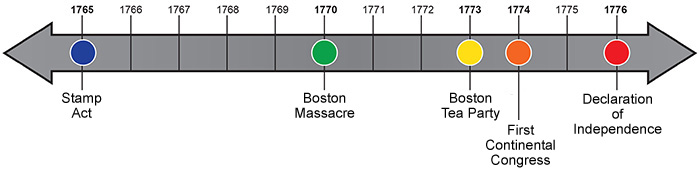
This timeline graphic is shaped like a double-headed arrow and is divided into single-year increments, a few of which are labeled with some of the major events leading up to the American Revolutionary War. Beginning with 1765, the timeline highlights the Stamp Act then proceeds to similarly spotlight the Boston Massacre in 1770, the Boston Tea Party in 1773, the First Continental Congress in 1774, and the Declaration of Independence in 1776.
This variety of graphic organizer can help students more fully comprehend series of events or phenomena that take on recurrent patterns.
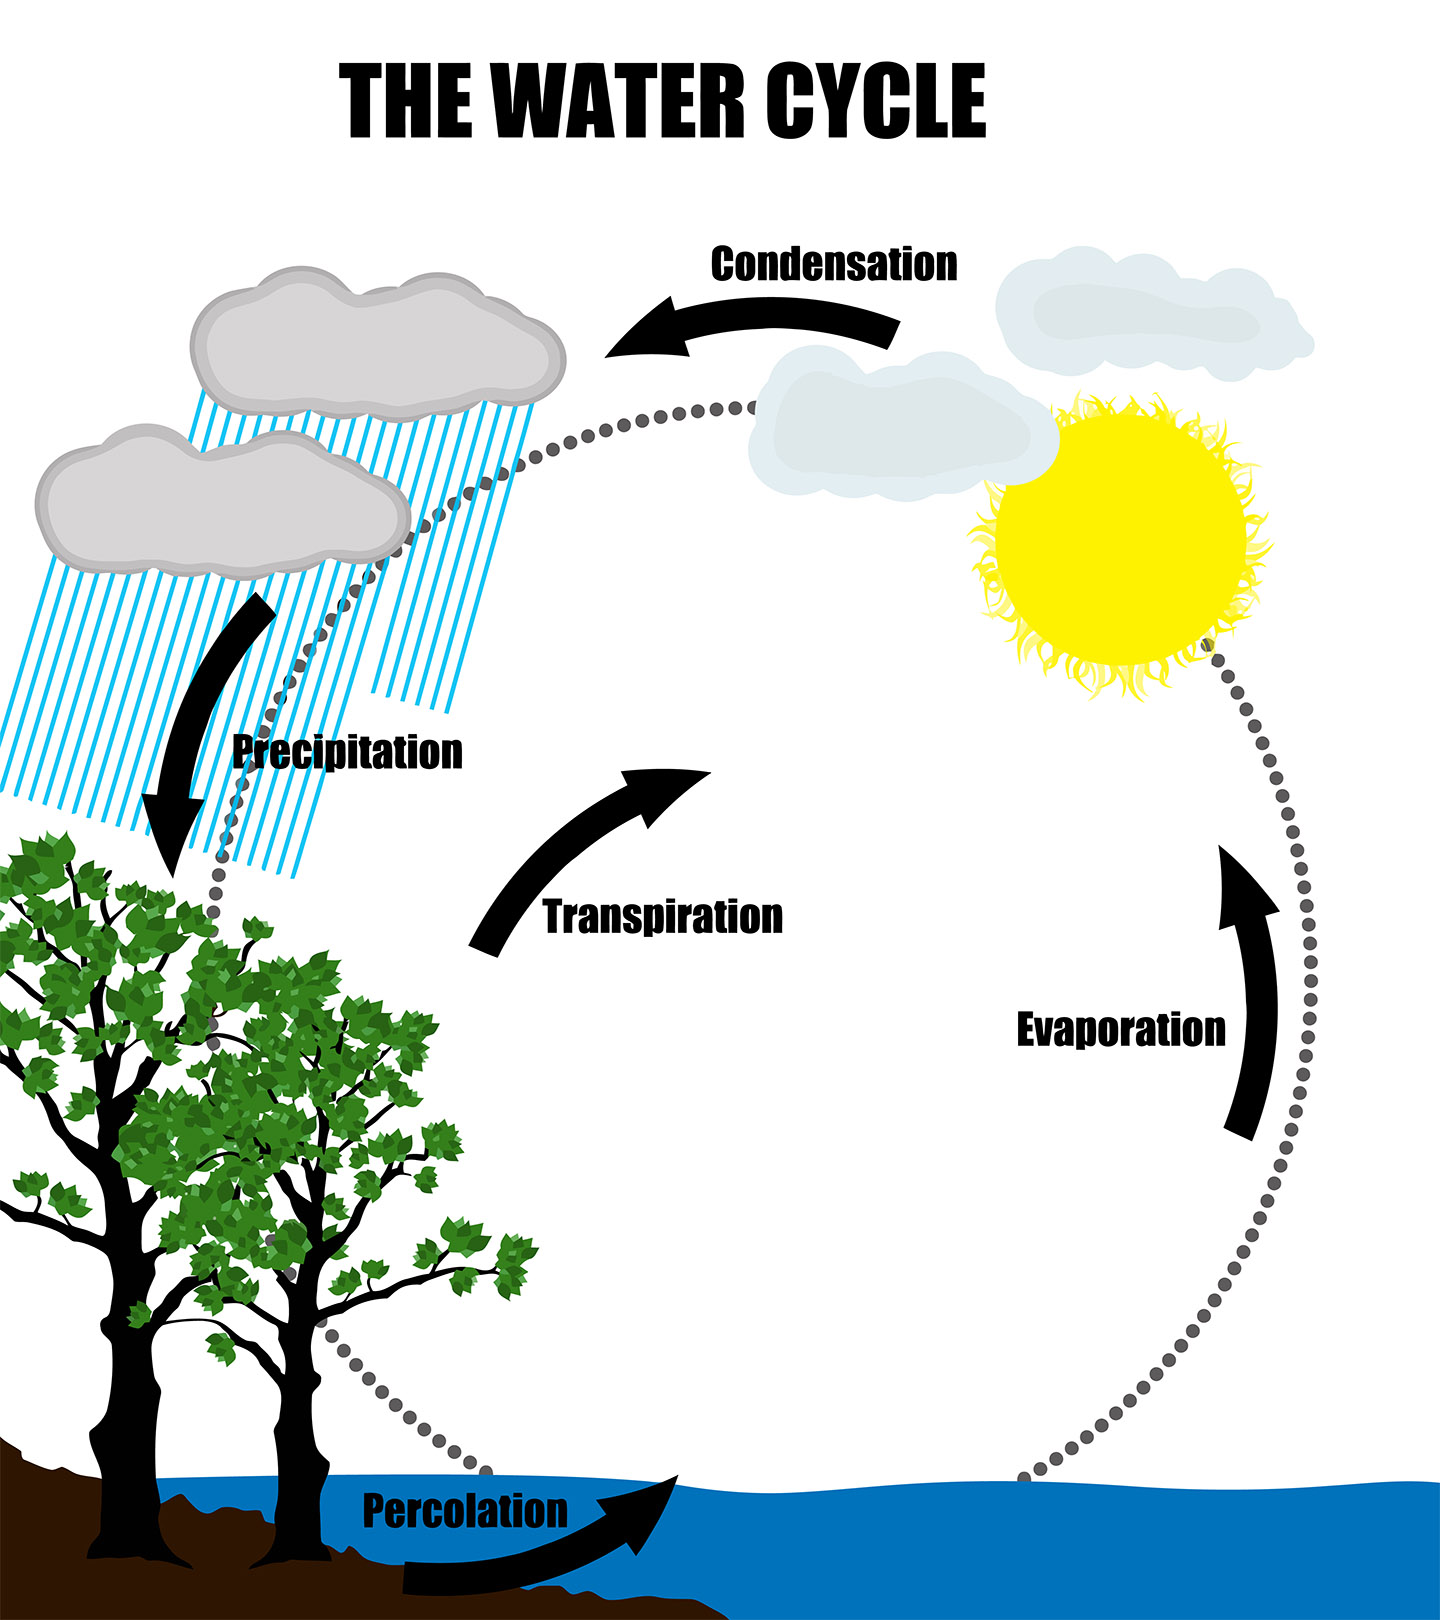
This graphic organizer shows the recurring pattern of the water cycle using labeled arrows: (1) Percolation and transpiration occur as water makes its way from the ground and plants, (2) evaporation occurs as water heats up and makes its way into the atmosphere, (3) condensation occurs as water cools to form clouds, and (4) precipitation occurs as water returns to the earth.
Activity
- Use a graphic organizer to organize the information regarding the five types described above.
- Ms. Draper’s third-grade class is beginning a lesson on the difference between butterflies and moths. Select one type of graphic organizer that she can use to achieve this goal and explain why you chose it.
- Mr. Gaikward, a high school geography teacher, wants his students to understand the social and economic importance of erosion and to consider how people can prevent erosion. Select one type of graphic organizer that he can use to meet this objective, and explain why you chose it.
- Given the grade level and subject content that you are teaching (or will be teaching), describe one topic for which you would use a sequencing graphic organizer. Explain why you chose this type of graphic organizer.
