Assistive Technology: An Overview
Assessment
Take some time now to answer the following questions. Please note that the IRIS Center does not collect your Assessment responses. If this is a course assignment, you should turn them in to your professor using whatever method he or she requires. If you have trouble answering any of the questions, go back and review the Perspectives & Resources pages in this module.
- Describe the relationship between accommodations and assistive technology.
- There are two interdependent aspects that make up AT. Identify and describe each.
-

Jade is a high school sophomore who has struggled academically since she was in elementary school. She has a learning disability and attention deficit/hyperactivity disorder. Like many students with LD and ADHD, she has difficulty processing information; retaining and recalling information; and selecting, monitoring, and using strategies. Although she is very creative and loves to share information with others, she has difficulty getting her thoughts on paper in a cohesive manner. Jade puts in a lot of hours working on homework, studying for tests, and attending after-school tutoring sessions, yet she struggles to make passing grades in several classes. Jade’s IEP team is in the process of determining if she would benefit from the use of AT.
- Based on the information in this scenario, consider whether Jade needs remediation or compensation. Justify your answer.
- Name at least two actions that need to occur if AT for Jade is identified and will be implemented.
After Jade’s IEP team reviews and discusses her performance level, they determine that AT is warranted. An AT implementation team is created to develop a plan to help guide implementation. The AT implementation team determines that Jade may benefit from the use of speech-to-text software in several classes.
- A parent of one of Jade’s classmates complains that it is not fair that one student gets to use speech-to-text software for written assignments and tests with essay questions. Offer the parent a general explanation as to why AT does not give students an unfair advantage. Keep in mind that student information is confidential and should be shared only with other professionals working with the student.
- Before Jade started using the speech-to-text software, her teachers collected baseline data on her performance on written assignments. They then collected implementation data. These data are recorded in the tables below.
Baseline Data
Week Performance on Written Assignments Week 1 55% Week 2 40% Week 3 25% Week 4 60% Week 5 50% Implementation Data
Week Performance on Written Assignments Week 6 70% Week 7 80% Week 8 75% Week 9 80% Week 10 85% Plot Jade’s progress on the graph by entering each of the data points from both the baseline data and implementation data boxes above. To begin, click the point for the data for Week 1 (baseline data).
Try again!To begin, click the point for the percent correct on Week 1 (Baseline data).This graph is labeled “Jade’s Graph.” The y-axis is labeled “Performance on Written Assignments,” the x-axis “Date.” The y-axis goes from zero to 100 in two-step increments. A dotted blue line bisects the graph. The first half is labeled “Baseline data,” the second “Implementation data.” The weeks in the x-axis in the “Baseline data” side are from “Week 1 through “Week 5.” The weeks in the x-axis in the “Baseline data” side are from “Week 6 through “Week 10.”
- Was the AT effective for Jade?
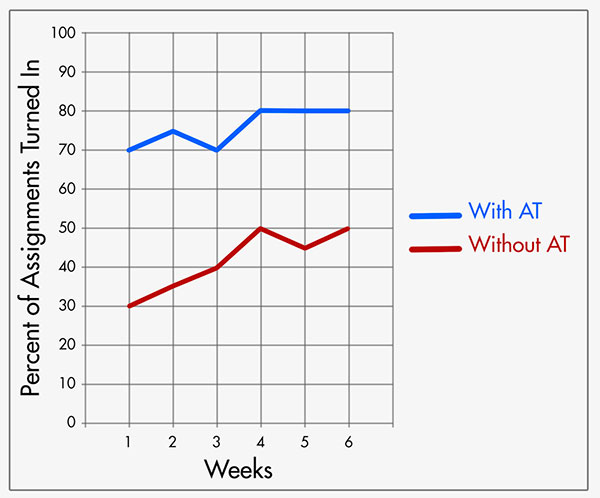
- The AT implementation team continues to monitor the effectiveness of Jade’s speech-to-text software. The data they have collected are displayed below. Describe what the data pattern indicates and how the implementation team should respond.

This graph demonstrates student progress both with and without the implementation of AT devices or services. The y-axis is labeled “Performance on Written Assignments” with segments spanning from zero to 100 in ten-step increments. The x-axis is labeled “Week” with segments spanning from one to six in one-step increments. A red line indicates student progress without the use of AT devices or services, showing average performance of 30, 35, 40, 50, 45, and 50 on written assignments, respectively. A blue line indicates student progress with the use of AT devices or services, showing average performance of 70, 75, 70, 80, 80, and 80 on written assignments, respectively.