Intensive Intervention (Part 1): Using Data-Based Individualization To Intensify Instruction
Wrap Up
Students with severe and persistent academic difficulties often do not respond adequately to targeted instruction (i.e., Tier 2 instruction, secondary level instruction). These students need more intensive intervention to demonstrate an improvement in academic performance. Data-based individualization, or DBI, offers a systematic approach to intensive intervention. DBI is a research-based process for gradually individualizing and intensifying interventions through the systematic use of assessment data, validated interventions, and instructional adaptations. DBI consists of five steps:
| Step 1: | Validated Intervention Program (with adaptations) |
| Step 2: | Progress Monitoring |
| Step 3: | Diagnostic Assessment |
| Step 4: | Intervention Adaptation |
| Step 5: | Progress Monitoring |

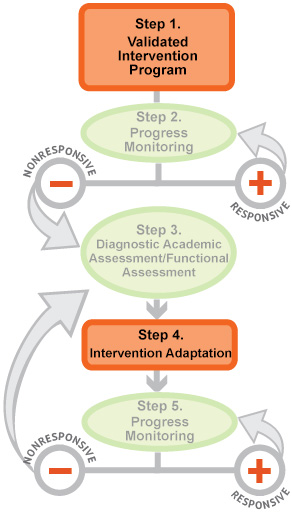
This graphic illustrates both the steps of data-based individualization, as well as they ways in which those steps interact. Step 1, “Validated Intervention Program,” is represented by an orange rectangle. This box connects via a vertical grey line to Step 2, “Progress Monitoring,” which is illustrated as a green oval. Both steps, in turn, are connected to a horizontal line with labeled circles at each of its ends. The circle on the left, “Nonresponsive,” has a red minus sign at its center, while the circle on the right, “Responsive,” has a red plus sign. A grey arrow connected to the “Nonresponsive” circle points toward Step 3 of the DBI process, “Diagnostic Academic Assessment/Functional Assessment,” which is represented as a green oval, similar to Step 2. The “Responsive” circle also has a grey arrow, this one pointing back up toward Step 2, “Progress Monitoring.”
Step 3 is connected via a vertical grey arrow to Step 4, “Intervention Adaptation,” represented as an orange rectangle. Another grey arrow connects Step 4 to Step 5, “Progress Monitoring,” another green oval. As above, these latter steps are connected to a horizontal line with labeled circles at each of its ends. The circle on the left, “Nonresponsive,” has a red minus sign at its center, while the circle on the right, “Responsive,” has a red plus sign. A large grey arrow connected to the “Nonresponsive” circle points back to Step 3, “Diagnostic Academic Assessment/Functional Assessment,” while the “Responsive” circle directs instructors back to Step 5, “Progress Monitoring.”
This module page focuses on Steps 1 and 4, so those orange boxes are highlighted whereas the rest of the graphic is slightly faded out.
This module addresses the two steps related to intensifying and individualizing instruction (Steps 1 and 4).
- Step 1: Validated Intervention Program—Teachers should intensify the secondary intervention by making quantitative changes (e.g., increase amount of instructional time, decrease group size).
- Step 4: Intervention Adaptation—After progress monitoring and a diagnostic assessment, teachers can adapt the intervention by making quantitative changes and/or qualitative changes (e.g., way in which content is delivered).
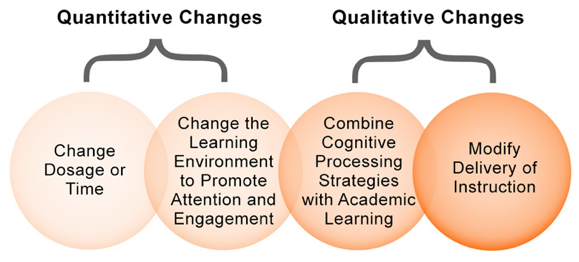
There are four main ways to intensify or individualize instruction. As the graphic below illustrates, these methods of adapting instruction range from the least intensive to the most intensive. To meet a student’s needs, the teacher might need to use a combination of quantitative and qualitative adaptations to intensify and individualize an intervention.

Vaughn, et al., 2013
This graphic represents the four main ways to intensify or individualize an instructional intervention, ranging from the least intensive to the most intensive. There are two quantitative changes and two qualitative ones, all represented as overlapping circles. Increasing intensification is represented by darkening colors; the circles start off light pink on the left and turn orange at the right. The first quantitative change is “Change Dosage or Time.” This circle overlaps with “Change the Learning Environment To Promote Attention and Engagement,” which in turn overlaps with the first qualitative change, “Combine Cognitive Processing Strategies with Academic Learning.” The final circle is labeled “Modify Delivery of Instruction.”
Listen as Chris Lemons discusses making quantitative and qualitative instructional adaptations during the DBI process (time: 1:54).

Transcript: Chris Lemons, PhD
In this module, you were introduced to two things. First of all, you were introduced to a process that teachers can use to individualize and intensify interventions: data-based individualization, or DBI. You also learned about quantitative and qualitative adaptations that can be made to interventions to improve outcomes for students. So this is an important process for teachers to learn about because a portion of students remain non-responsive to evidence-based practices delivered with fidelity, and DBI is a process that can help teachers meet the needs of these students. As teachers are adapting interventions, it’s really important to use a process that’s systematic and to use data to guide those adaptations, and DBI is a process that can help teachers do that.
I think it’s important to remember that DBI is a process typically reserved for students who have been non-responsive to evidence-based practices that were implemented with fidelity in Tiers 1 and 2. So two important points: Intervention services for students in Tier 3 and special education should be more intensive than the services provided to students in the lower Tiers. And DBI provides a process for teachers to ensure that the students in the top Tier of an RTI or MTSS system or students in special education are receiving interventions that are more intensive than those provided in Tiers 1 and 2. And I think limiting the number of students who receive DBI can really ensure that resources are provided, that staff have sufficient time to really use the data to individualize instruction for this group of kids.
I think it’s also important to remember that DBI can help special education teachers improve outcomes for their students. It can assist teachers in serving the role of being a clinical expert who really uses data to individualize interventions. And I think this process really has a lot of potential to ensure that special education services provided to students with disabilities are truly special.
Revisiting Initial Thoughts
Think back to your initial responses to the following questions. After working through the resources in this module, do you still agree with your Initial Thoughts? If not, what aspects of your answers would you change?
What is data-based individualization?
How can school personnel intensify and individualize instruction?
When you are ready, proceed to the Assessment section.