How can school personnel intensify and individualize instruction?
Page 10: Making Instructional Decisions for Mathematics
 Cole is a second-grade student who has persistent difficulties in mathematics. Although Cole seems to have a good understanding of basic mathematics facts, he has difficulty with subtracting multi-digit numbers. Therefore, he received targeted instruction (Tier 2 instruction):
- In a small group of 4 children
- In a heterogeneous group
- For 2 times per week
- For 15 minutes per session
- For 8 weeks
- Using a validated mathematics program
After eight weeks of targeted instruction, Cole’s weekly progress monitoring data indicate that he is not making adequate progress. Consequently, the student support team decides it is time to implement DBI.
Keep in Mind
Some of the information on this page mirrors that provided on the “Making Data-Based Instructional Decisions for Mathematics” page of the IRIS Module Intensive Intervention (Part 2): Collecting and Analyzing Data for Data-Based Individualization, which focuses on Steps 2, 3, and 5 of the DBI process.Begin the DBI Process
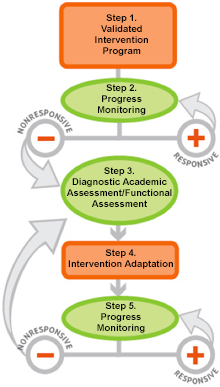
Step 1: Validated Intervention Program
The student support team decides to make quantitative changes to the validated program used during targeted instruction and to implement it for six weeks. The adapted intervention will be delivered:
- In a small group of 3 students
- In a homogenous group
- For 3 times per week
- For 20 minutes per session
Activity
Compare the instruction that Cole received in targeted instruction to that he will receive once the DBI process begins. How much more instructional time will Cole receive once he begins intensive intervention?
Step 2: Progress Monitoring
After making these quantitative changes, Cole’s teacher continues to monitor his progress (Step 2) for five weeks. Although Cole’s progress monitoring scores are improving, they are not improving enough for him to reach his year-end goal. Because of this, Cole seems to need additional intervention adaptations to support his learning needs.
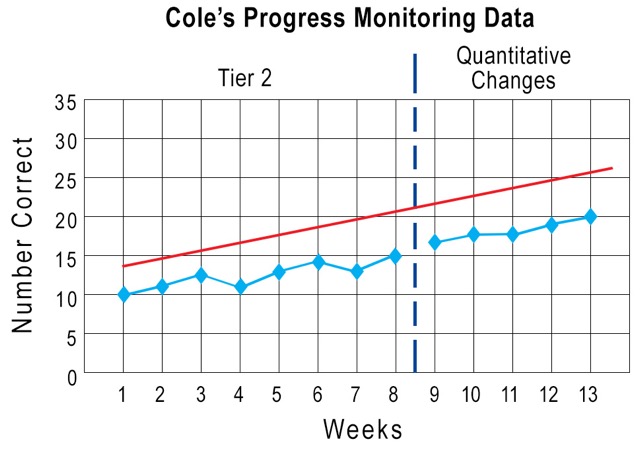
This graph displays Cole’s progress monitoring data over a span of thirteen weeks, which here form the x-axis and which is divided by a vertical blue dotted line after week eight and a half. The left side of this line is labeled “Tier 2,” whereas the section after the line is labeled “Quantitative Changes.”
The y-axis is labeled “Number Correct” and is divided into five-point increments from 0 to 35. Cole’s goal line is represented by a red line that begins just below 15 correct responses and ends at 20 correct responses.
Cole’s actual correct responses are represented by a blue line that indicates the following numbers: 10, 11, 13, 10, 14, 15, 13, 15, 16, 17, 17, 19, and 20. At all points, Cole’s progress is beneath his goal line.
Keep in Mind
Steps 2, 3, and 5 related to data collection and analysis are explained in detail in the IRIS Module:
Step 3: Diagnostic Assessment
Because the data suggest that Cole is not making sufficient progress, his teacher conducts an informal diagnostic assessment, which includes an error analysis of one of Cole’s worksheets. Informal diagnostic assessments help determine what specific skills the student is struggling with. The data indicate that Cole is having difficulty with subtraction. He seems to always subtract the lesser number from the greater number, regardless of whether the lesser number is on the top (minuend) or the bottom (subtrahend). As part of the diagnostic assessment, the student support team reviewed Cole’s graphed progress monitoring data. They noted that Cole’s progress monitoring scores fall below the goal line.
error analysis
glossary
Step 4: Instructional Adaptation
The student support team reconvened to examine Cole’s progress monitoring and diagnostic assessment data to make a decision regarding instructional adaptations that will likely help Cole make adequate progress. Because his progress monitoring scores are approaching the goal line, they think that more focused instruction on his specific skill deficit will be more beneficial than increasing the amount of intervention he receives. Cole’s support team recommends the following qualitative instructional adaptations:
- Explicit instruction on regrouping
- Self-instruction
Activity
Review the two adaptations recommended for Cole in Step 4. Explain how each of the two adaptations will address Cole’s learning needs.
The two adaptations will address Cole’s learning needs in the following ways.
- Explicit instruction: By using explicit instruction, Cole’s teacher can teach him how to perform the correct operation for subtracting greater numbers from lesser numbers in a structured manner, as well as model this skill. The teacher can then guide Cole through this process and provide corrective feedback.
- Self-instruction: This strategy will help Cole talk himself through the steps of the correct mathematical operation. He can also use this strategy to check his answers.
Step 5: Progress Monitoring
Progress monitoring data were collected for another six weeks. The data indicate that Cole is making adequate progress and will meet his end-of-year goals. Because of his progress, the student support team decides to continue implementing the current intervention and monitor his progress.
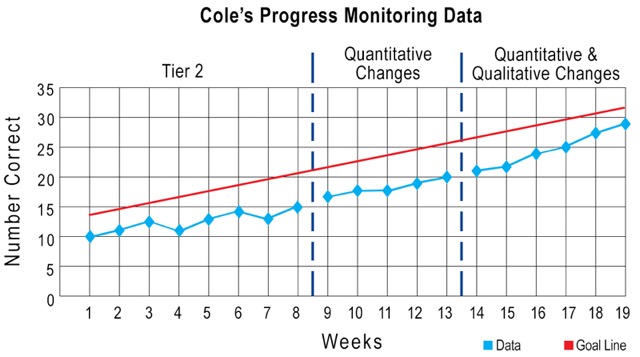
This graph displays Cole’s progress monitoring data over a span of nineteen weeks, which here form the x-axis and which is divided by a vertical blue dotted line after week eight and a half. The left side of this line is labeled “Tier 2,” whereas the section after the line is labeled “Quantitative Changes.” At week thirteen and a half, another vertical dotted line divides the graph. From that point until week 19, the graph is labeled “Quantitative and Qualitative Changes.”
The y-axis is labeled “Number Correct” and is divided into five-point increments from 0 to 35. Cole’s goal line is represented by a red line that begins just below 15 correct responses and ends at 20 correct responses.
Cole’s actual correct responses are represented by a blue line that indicates the following numbers: 10, 11, 13, 10, 14, 15, 13, 15, 16, 17, 17, 19, 20, 21, 22, 24, 25, 27, and 29. At all points, Cole’s progress is beneath his goal line.
Keep in Mind
Although Cole made adequate progress with the current intervention, some students with severe and persistent learning difficulties might need to repeat the last three steps of the DBI process (i.e., diagnostic assessment, intervention adaptation, progress monitoring) multiple times to reach the level of intensity and individualization required for the student to make adequate progress.
![]()
Summary
Although Cole has learned how to regroup when subtracting a greater from a lesser number, the teacher must continue to collect progress monitoring data to assess his performance on an ongoing basis. By collecting data, the teacher can make sure that Cole continues to apply this skill consistently and that he is not struggling with other skills.