Case Study
Measuring Behavior

Case Study
Measuring Behavior
Introduction
 Data collection is a critical part of understanding student behavior and making informed decisions. A systematic process for collecting and analyzing behavioral data reduces subjectivity and helps educators more easily identify patterns in student behavior. By consistently and accurately measuring student behavior, educators can:
- Monitor student progress over time
- Identify patterns related to when, where, and how behavior occurs
- Determine if behavioral supports and interventions have been effective
- Decide if an intervention should be continued, adapted, or stopped
- Communicate behavioral progress to students, parents, and other school professionals
Operationally Defining a Behavior
Before collecting any data, educators need to define the target behavior (i.e., the specific interfering behavior in need of change) and the replacement behavior (i.e., an appropriate alternative behavior that serves the same function as the target behavior). Educators might collect data on the student’s engagement in either or both behaviors.
To facilitate consistent and accurate data collection, educators must develop an operational definition—a clear and specific description of the behavior to be measured. This definition should begin with a broad statement describing the behavior in terms that are:
- Observable: Details what the behavior looks and sounds like, not what the student might be thinking or feeling
- Measurable: Describes the behavior in such a way that it can be counted or timed
- Actively Stated: Specifies what the student does rather than what they fail to do
It is also helpful to include specific examples and non-examples of the behavior as part of the operational definition. These additional details help clarify the definition by illustrating what constitutes a behavior when collecting data. Below are examples of operational definitions for a student’s target and replacement behaviors.
| Target Behavior | Definition
Mandy uses classroom materials or school property in a manner other than their intended purpose, resulting in potential or actual damage. |
Examples
|
Non-Examples
|
| Replacement Behavior | Definition
Mandy manipulates designated objects kept in a calm-down kit at her desk. |
Examples
|
Non-Examples
|
Selecting a Data Collection Method
Common Data Collection Methods
Direct Behavior Rating (DBR)—this method involves rating the extent to which a student engages in a behavior
Systematic direct observation (SDO)—this method involves measuring how often a behavior occurs or how long it lasts
Scatterplot recording—this method involves recording whether a behavior occurred during a given period
Each of these methods, which align with different behavioral needs and classroom realities, will be explored on subsequent STAR Sheets.
Educators can use a variety of methods to collect behavioral data. However, the best method will depend on the unique student, behavior, and context. As such, educators should be knowledgeable about multiple options and select a method that:
- Aligns with a student’s behavior as operationally defined
- Captures the frequency, intensity, or other dimensions of the behavior as accurately as possible
- Is sensitive enough to show when the behavior has changed
- Is feasible for the educator to use in the classroom
In addition to selecting an appropriate method, educators must also decide:
- Who will collect data
- Where data will be collected
- How often data will be collected
- How data will be documented, stored, and graphed
- When and how progress will be communicated
For Your Information
- Everyone who collects data must have a common understanding of the behavior and the data collection method. For instance, the art teacher needs to use the same operational definition and the same data collection procedure that the classroom teacher uses. To ensure consistency, all school staff who will be involved in data collection should be trained and supported.
- After several observations, it can be easy to drift from the operational definition. To reduce the likelihood of observer drift, observers should review the operational definition frequently. When documenting data, the observer should record only what is directly observed, without interpreting the meaning or intent of the behavior.
Tiered Systems
Many schools implement a multi-tiered system of supports (MTSS), such as Positive Behavioral Interventions and Supports (PBIS), for school-wide behavior management. PBIS consists of three tiers—Tier 1, Tier 2, and Tier 3—through which educators can provide a continuum of supports and services to promote appropriate behaviors and to prevent and address interfering behaviors.
|
Tier 1 (sometimes referred to as primary or universal prevention) is effective school-wide or classroom behavior management, which includes teaching students appropriate behavior. Tier 1 typically meets the needs of about 80% of students. |
|
Tier 2 (also referred to as targeted or secondary prevention) offers targeted supports to groups of students with similar needs. Approximately 15% of students will require Tier 2 supports. |
|
Tier 3 (also referred to as tertiary intervention or intensive, individualized prevention) offers an individualized support plan based on assessment data. Only about 5% of students should require Tier 3 supports. |
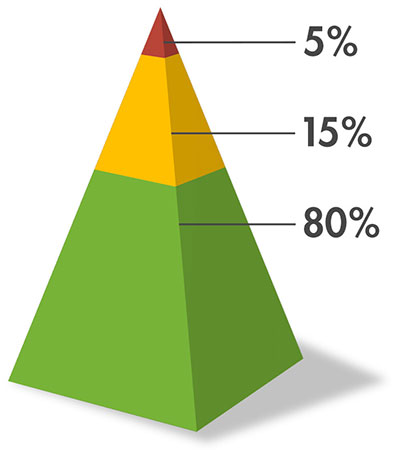
Across all three tiers of PBIS, educators collect behavioral data to track students’ growth and make data-based decisions. They do this using progress monitoring—a type of formative assessment that allows them to frequently and continuously evaluate student behavior, assess the effectiveness of instruction and intervention, and make changes to improve students’ progress. Each of the data collection methods defined above can be used to collect progress monitoring data.
Alberto, P. A., Troutman, A. C., & Axe, J. B. (2022). Applied behavior analysis for teachers (10th ed.). Pearson.
Briesch, A. M., Volpe, R. J., & Floyd, R. G. (2018). School-based observation: A practical guide to assessing student behavior. Guilford Press.
Bruhn, A., & McDaniel, S. (2016, October 27). Tier 2 progress monitoring: Using data for decision making. Center on PBIS. https://www.pbis.org/resource/tier-ii-progress-monitoring-using-data-for-decision-making
Idaho Training Center. (n.d.). Behavior progress monitoring. https://idahotc.com/c/n/behaviorpm
Missouri Department of Elementary and Secondary Education. (2018). Missouri schoolwide positive behavior support: Tier 3 team workbook. https://pbismissouri.org/wp-content/uploads/2018/05/MO-SW-PBS-Tier-3-2018-04.24.18.pdf
PROGRESS Center. (2023, August 10). Using behavior progress monitoring for individualized instructional planning [Video]. YouTube. https://www.youtube.com/watch?v=B5UfDxbUacE
Walker, J. D., & Barry, C. (2022). Behavior management: Systems, classrooms, and individuals. Plural Publishing.
For additional information about content discussed in this STAR Sheet, review the following IRIS resources. Please note that these resources are not required readings to complete this case study.

This case study describes how to clearly define a student’s behavior so that when they occur, they can be reliably identified, measured, or counted in some way. This case study can serve as a companion for the functional behavioral assessment modules, Functional Behavioral Assessment (Elementary): Identifying the Reasons for Student Behavior and Functional Behavioral Assessment (Secondary): Identifying the Reasons for Student Behavior.
Each case study includes multiple STAR Sheets and cases.

STAR (STrategies And Resources) Sheets—These provide a description of a well-researched strategy that can help you solve the cases.

Cases—These present a problem-based classroom issue or challenge and an assignment, which can be completed using one or more of the STAR Sheets. There are three progressive levels of cases: Level A (gathering information), Level B (analyzing information), and Level C (synthesizing information).
STAR Sheet
Direct Behavior Rating
About the Strategy
 Direct Behavior Rating (DBR) is a method of data collection that combines observation and rating scales. When using this method, educators observe the student during regularly scheduled periods and rate the extent to which the student demonstrates a target or replacement behavior using a predetermined scale.
What the Research and Resources Say
- DBR produces valid measurements of student behavior, yielding similar results to traditional direct observation methods (Chafouleas et al., 2012b; Fabiano et al., 2017; Smith et al., 2018).
- DBR is particularly efficient because an educator can monitor a student’s behavior while simultaneously carrying out regular teaching responsibilities (Briesch et al., 2016).
- When behaviors are operationally defined and observers are trained, DBR can capture consistent measurements across multiple observers and settings (Briesch et al., 2013; Casale et al., 2021; Chafouleas et al., 2012a).
- Because DBR effectively represents behavioral changes over time, it is a useful tool for progress monitoring (Chafouleas et al., 2012b; Fabiano et al., 2017; Hustus et al., 2018; Matta et al., 2020; Smith et al., 2018).
- The table below highlights categories of behaviors that can be effectively measured using DBR.
| Behavior measured | Citations |
| Academic engagement (e.g., raising a hand, engaging with materials, making on-topic comments) | Casale et al., 2021; Chafouleas et al., 2013; Chafouleas et al., 2012b; Fabiano et al., 2017; Hustus et al., 2018; Kilgus et al., 2014; Johnson et al., 2016; Matta et al., 2020; Smith et al., 2018 |
| Disruptive behavior (e.g., throwing objects, calling out, cursing) | Chafouleas et al., 2012b; Chafouleas et al., 2013; Daniels et al., 2021; Hustus et al., 2018; Kilgus et al., 2014; Johnson et al., 2016; Matta et al., 2020; Smith et al., 2018; Wickerd & Hulac, 2017 |
| Respectful behavior (e.g., following directions, prosocial interactions, making polite requests) | Fabiano et al., 2017; Kilgus et al., 2014; Johnson et al., 2016 |
Steps for Implementation
After identifying and operationally defining the behavior to be measured, educators can use the steps below to collect DBR data.
- Create an observation schedule: Observations should occur during times when the behavior is expected to happen and on a regular schedule (e.g., every day during math class, every time students are working independently). The length of observation periods can vary based on context and the behavior being monitored. Observation periods could be as brief as 15 minutes or as long as the entire school day.
- Select or develop a rating scale: Ratings are typically scored on a numerical scale to measure one of the following dimensions:
- Percentage of time the student was engaged in the behavior (0%–100%)
- Intensity of the student’s behavior across the observation period (e.g., 0 = no behavior observed, 3 = mild, 7 = moderate, 10 = severe)
Direct Behavior Rating (DBR) Recording Form
Directions
- Complete the information at the top of the form.
- For each observation period, complete the date, start and end times of the observation, observer, and activity.
- At the end of each observation, make a mark on the rating line to indicate the approximate percentage of the time interval the student demonstrated the behavior.
Student: Rowan
Behavior: Rowan engages with assigned instructional materials according to teacher directions and their intended function.
Date: 10/8/20XX
Start Time: 8:30 a.m.
End Time: 9:00 a.m.
Observer: Ms. Swanson
Activity: morning work

Percentage of Total Time Demonstrating Behavior
Date: 10/8/20XX
Start Time: 9:00 a.m.
End Time: 9:30 a.m.
Observer: Ms. Swanson
Activity: math instruction and independent work

Percentage of Total Time Demonstrating Behavior
Date: 10/8/20XX
Start Time: 9:30 a.m.
End Time: 10:00 a.m.
Observer: Ms. Swanson
Activity: phonics instruction

Percentage of Total Time Demonstrating Behavior
Date: 10/8/20XX
Start Time: 10:00 a.m.
End Time: 10:30 a.m.
Observer: Ms. Swanson
Activity: small-group reading

Percentage of Total Time Demonstrating Behavior
Date: 10/8/20XX
Start Time: 10:30 a.m.
End Time: 11:00 a.m.
Observer: Ms. Swanson
Activity: writer’s workshop

Percentage of Total Time Demonstrating Behavior
This template is adapted from Chafouleas et al. (2010).
Download a copy of a sample Director Behavior Rating recording form.
- Conduct observations: Using the observation schedule developed in Step 1, the educator monitors the student’s defined behavior while continuing their usual teaching activities.
- Rate and record the behavior’s occurrence: As soon as the observation period is over (e.g., at the end of a lesson, after recess), the educator marks the best estimate of the behavior’s occurrence using the scale created in Step 2. Ratings can be documented on paper forms, computerized systems, or mobile apps.
- Organize the data: The data should be organized in a way that supports interpretation and decision-making. For example:
- Numerical data from multiple days or weeks can be entered into a simple table or chart for comparison.
- Plotting the data on a line graph supports visual analysis of changes in the amount, severity, or consistency of the behavior over time. (For more information, review the Graphing Data STAR Sheet.)
Tips for Implementation
- To collect more objective data and avoid bias, create a DBR scale that uses numbers (e.g., 0%–100%) to measure the extent of a behavior rather than a categorical scale (e.g., never, rarely, sometimes, often, always). Because collecting DBR data is designed to be quick and nondisruptive while teaching, rely on mental notes during the lesson and quickly record your rating immediately afterward.
- For the most accurate data, assign a consistent person to observe and rate the student’s behavior during each class period or activity. For example, have the math teacher always record DBR data during math class, rather than having a paraeducator record on some days and the math teacher on others.
- Add brief written notes about the nature of the observed behavior alongside the numerical rating to provide additional description or context.
- Calculate the average DBR rating across days or time periods to reveal patterns of behavior.
Average Calculation
Average = sum of all ratings ÷ number of ratings
Example: Average = (60% + 80% + 70% + 40% + 60%) ÷ 5 = 62%
For Your Information
- Educators can use DBR to collect data on one or more behaviors at a time. In either case, the observer must rely on the operational definition of each behavior to provide the most objective ratings possible.
- DBR can also be integrated into behavioral interventions, such as check-in/check-out systems. In these situations, the educator typically shares the rating with the student at the end of each observation period and provides reinforcement if a predetermined score was met.
check-in/check-out (CICO)
glossary
Briesch, A. M., Kilgus, S. P., Chafouleas, S. M., Riley-Tillman, T. C., & Christ, T. J. (2013). The influence of alternative scale formats on the generalizability of data obtained from Direct Behavior Rating Single-Item Scales (DBR-SIS). Assessment for Effective Intervention, 38(2), 127–133. doi:10.1177/1534508412441966
Briesch, A. M., Chafouleas, S. M., & Riley-Tillman, T. C. (2016). Direct Behavior Rating: Linking assessment, communication, and intervention. Guilford Press.
Casale, G., Volpe, R. J., Briesch, A. M., Hennemann, T., & Grosche, M. (2021). Dependability of Direct Behavior Rating Single- and Multi-Item Scales across raters and occasions in two school subjects. Assessment for Effective Intervention, 46(2), 143–154. doi:10.1177/1534508419836498
Chafouleas, S. M., Riley-Tillman, T. C., & Christ, T. J. (2010). Directions for using a Direct Behavior Rating (DBR) form. Direct Behavior Rating. https://direct-behavior-ratings.education.uconn.edu/wp-content/uploads/sites/916/2015/08/Directions-for-using-DBR-Form.pdf
Chafouleas, S. M., Kilgus, S. P., Riley-Tillman, T. C., Jaffery, R., & Harrison, S. (2012a). Preliminary evaluation of various training components on accuracy of Direct Behavior Ratings. Journal of School Psychology, 50(3), 317–334. doi:10.1016/j.jsp.2011.11.007
Chafouleas, S. M., Sanetti, L. M., Kilgus, S. P., & Maggin, D. M. (2012b). Evaluating sensitivity to behavioral change using Direct Behavior Rating Single-Item Scales. Exceptional Children, 78(4), 491–505. doi:10.1177/001440291207800406
Chafouleas, S. M., Kilgus, S. P., Jaffery, R., Riley-Tillman, T. C., Welsh, M., & Christ, T. J. (2013). Direct Behavior Rating as a school-based behavior screener for elementary and middle grades. Journal of School Psychology, 51(3), 367–385. doi:10.1016/j.jsp.2013.04.002
Chafouleas, S. M., Johnson, A. H., Riley-Tillman, T. C., & Iovino, E. A. (2021). School-based behavioral assessment: Informing prevention and intervention (2nd ed.). Guilford Press.
Daniels, B., Briesch, A. M., Volpe, R. J., & Owens, J. S. (2021). Content validation of Direct Behavior Rating Multi-Item Scales for assessing problem behaviors. Journal of Emotional and Behavioral Disorders, 29(2), 71–82. doi:10.1177/1063426619882345
Fabiano, G. A., Pyle, K., Kelty, M. B., & Parham, B. R. (2017). Progress monitoring using Direct Behavior Rating Single Item Scales in a multiple-baseline design study of the Daily Report Card intervention. Assessment for Effective Intervention, 43(1), 21–33. doi:10.1177/1534508417703024
Hustus, C. L., Owens, J. S., Volpe, R. J., Briesch, A. M., & Daniels, B. (2020). Treatment sensitivity of Direct Behavior Rating–Multi-Item Scales in the context of a daily report card intervention. Journal of Emotional and Behavioral Disorders, 28(1), 29–42. doi:10.1177/1063426618806281
Johnson, A. H., Miller, F. G., Chafouleas, S. M., Welsh, M. E., Riley-Tillman, T. C., & Fabiano, G. (2016). Evaluating the technical adequacy of DBR-SIS in tri-annual behavioral screening: A multisite investigation. Journal of School Psychology, 54, 39–57. doi:10.1016/j.jsp.2015.10.001
Kilgus, S. P., Riley-Tillman, T. C., Chafouleas, S. M., Christ, T. J., & Welsh, M. E. (2014). Direct Behavior Rating as a school-based behavior universal screener: Replication across sites. Journal of School Psychology, 52(1), 63–82. doi:10.1016/j.jsp.2013.11.002
Koslouski, J. B., Stark, K., Chafouleas, S. M., & Riley-Tillman, T. C. (2023). Considering equity of evidence: Examining teachers’ justifications for Direct Behavior Rating scale scores. School Mental Health: A Multidisciplinary Research and Practice Journal, 15(2), 552–565. doi:10.1007/s12310-023-09570-5
Matta, M., Volpe, R. J., Briesch, A. M., & Owens, J. S. (2020). Five Direct Behavior Rating Multi-Item Scales: Sensitivity to the effects of classroom interventions. Journal of School Psychology, 81, 28–46. doi:10.1016/j.jsp.2020.05.002
Music, A., Riley-Tillman, T.C., & Chafouleas, S. M. (2010). Direct Behavior Rating (DBR): An overview for teachers. University of Connecticut. https://direct-behavior-ratings.education.uconn.edu/wp-content/uploads/sites/916/2017/04/dbr-overview-for-teachers.pdf
Smith, R. L., Eklund, K., & Kilgus, S. P. (2018). Concurrent validity and sensitivity to change of Direct Behavior Rating Single-Item Scales (DBR-SIS) within an elementary sample. School Psychology Quarterly, 33(1), 83–93. doi:10.1037/spq0000209
Wickerd, G., & Hulac, D. (2017). Generalizability and dependability of a multi-item Direct Behavior Rating scale in a kindergarten classroom setting. Journal of Applied School Psychology, 33(2), 109–123. doi:10.1080/15377903.2016.1264530
STAR Sheet
Systematic Direct Observation
About the Strategy
 Systematic direct observation (SDO) requires an observer to precisely measure how often a target or replacement behavior occurs or how long it lasts. Data can be captured using one of the following four methods.
- Frequency or event recording—documenting the number of times a behavior occurs within a given period (e.g., the number of times a student calls out during a one-hour lesson)
- Interval recording—documenting whether a behavior occurred during brief periods or intervals (e.g., the number of one-minute intervals in which the student was out of their seat for any portion of time)
- Duration recording—documenting how long a student engages in a behavior (e.g., time spent on task during independent work)
- Latency recording— documenting the amount of time that elapses between when a direction or prompt is given and when the student begins the behavior (e.g., time between giving a student an assignment and the student beginning to work)
What the Research and Resources Say
- When observers use consistent definitions and procedures, SDO data provide a clearer picture of behavior than informal observations or memory-based reports (Lane & Ledford, 2014; LeBlanc et al., 2020).
- Although frequency and duration recording are considered the most accurate SDO methods, they might not be the most feasible in typical classroom settings because they require an observer’s undivided attention (Alberto et al., 2022; Briesch et al., 2018; Ledford et al., 2015).
- In a busy classroom, interval recording can be a more practical way to approximate the frequency or duration of a behavior (Yoder et al., 2018; Zakszeski et al., 2017).
- Interval recording is most accurate when intervals are short. While intervals between 15 and 20 seconds are commonly recommended, intervals should be no longer than three minutes (LeBlanc et al., 2020; Ledford et al., 2015; Zakszeski et al., 2017).
Steps for Implementation
After identifying and operationally defining the behavior to be measured, use the steps below to collect SDO data.
- Choose the appropriate method: The selected recording method must be appropriate for the nature of the behavior being measured.
- Frequency or event recording—use for relatively brief behaviors with a clear beginning and end (e.g., shouting, hand raising, kicking)
- Interval recording—use for behaviors that occur frequently or continuously (e.g., off-task behavior, academic engagement), or for when it is not feasible to count or time every instance of the behavior
- Duration recording—use for sustained behaviors when the amount of time spent engaging in the behavior is the primary concern (e.g., crying episodes, attention to task, tantrums)
- Latency recording—use for capturing the time between an instruction being given and the behavior beginning or ending (e.g., delayed transitions, delayed response to directions)
- Create an observation schedule: Observations should occur during times when the behavior is expected to happen and should last long enough to capture multiple instances of the behavior.
- Select or develop a recording form: The documentation system needs to align with the method selected in Step 1. Data can be documented on paper forms, computerized systems, or mobile apps.
Frequency/Event Recording Form
Directions: Make a mark each time the behavior occurs. To calculate rate, divide the total number of occurrences by the length of the observation.
Student: Shiloh
Date: 11/15/20XX
Class/Teacher: Reading/Mr. Morriggia
Observer: Mrs. Hale
Behavior: Any instance where Shiloh initiates physical contact with a peer’s body, hair, or clothing without explicit verbal or non-verbal invitation/consent from the peer.
| Start Time | End Time | Total Time | Tally | Total Occurrences | Rate |
| 9:00 a.m. | 9:14 a.m. | 14 min |  |
3 | 0.21/min |
| 9:20 a.m. | 9:45 a.m. | 25 min |  |
5 | 0.2/min |
| 10:03 a.m. | 10:35 a.m. | 32 min |  |
8 | 0.25/min |
Interval Recording Form
Directions: Circle “+” for occurrence of behavior and “–” for nonoccurrence of behavior. Count the number of intervals during which the behavior occurred. Divide this number by the total number of intervals and multiply by 100 to determine the percentage of intervals during which the behavior occurred.
Student: Beckett
Date: 2/26/20XX
Class/Teacher: Social Studies/Mr. Vasquez
Observer: Mr. O’Brien
Start/End Times: 3:00 p.m. – 3:30 p.m.
Length of Interval: 1 min
Behavior: At any point during the interval, Beckett stands up, steps away, or moves out of a seated position at their assigned workspace without teacher permission or a transition cue.
| Interval | Behavior | Interval | Behavior |
| Example |  – – |
16 | +  |
| 1 | + |
17 | + |
| 2 | – |
18 | + |
| 3 | + |
19 | + |
| 4 | + |
20 | – |
| 5 | + |
21 | + |
| 6 | + |
22 | – |
| 7 | – |
23 | – |
| 8 | – |
24 | + |
| 9 | – |
25 | + |
| 10 | + |
26 | – |
| 11 | – |
27 | – |
| 12 | + |
28 | – |
| 13 | + |
29 | – |
| 14 | – |
30 | – |
| 15 | – |
Total % | 50 % |
Duration Recording Form
Directions
- When the behavior begins, mark the start time.
- When the behavior ends, note the end time.
- Record the length of time that the behavior occurred.
- Repeat the above steps until the end of the observation period.
- Calculate the total duration by adding the duration of each episode during the observation period.
Student: Dakota
Date: 2/20/20XX
Class/Teacher: Language Arts/Ms. Ali
Observer: Dr. Crawford
Observation Period: 12:30 p.m. – 2:00 p.m.
Behavior: Any period where the student places their forehead, face, or head flat onto their desk or arms, disengaging from classroom activities.
| Start Time | End Time | Duration |
| 12:32 p.m. | 12:37 p.m. | 5 min |
| 12:59 p.m. | 1:08 p.m. | 9 min |
| 1:40 p.m. | 1:42 p.m. | 2 min |
| Total Duration | 16 min | |
Latency Recording Form
Directions
- Start the stopwatch when the prompt, directive, or instruction is provided.
- Stop the stopwatch when student complies.
- Record the number of seconds or minutes that elapsed between the end of the direction and the onset of the compliance.
- Repeat the above steps until the end of the observation period.
- Calculate the average latency of the behavior by dividing the total latency by the number of occurrences.
Student: Zuri
Date: 12/4/20XX
Class/Teacher: Geometry/Mr. Navarro
Observer: Mrs. Ellison
Behavior: Following a verbal or non-verbal teacher direction, Zuri initiates the first physical action required for the task (e.g., picking up a pencil, opening a book).
| Time of request or cue (start stopwatch) |
Time behavior was initiated (end stopwatch) |
Latency |
| 8:56:08 | 8:57:49 | 1 min, 41 sec |
| 9:11:37 | 9:14:12 | 2 min, 35 sec |
| 9:26:50 | 9:31:44 | 4 min, 54 sec |
| 9:43:26 | 9:44:02 | 36 sec |
| Total Average Latency | 2 min, 26.5 sec | |
- Identify and train observer(s): One or more individuals (e.g., paraeducator, school psychologist) can conduct observations while the educator goes about usual instruction. Observers should be trained to understand the behavioral definition and the procedures for data collection.
- Conduct observations and record data: Using the observation schedule developed in Step 2, the observer watches the student and records instances of the defined behavior throughout the observation session.
- Organize the data: The data should be organized in a way that supports interpretation and decision-making. For example:
- Numerical data from multiple days or weeks can be entered into a simple table or chart for comparison.
- Plotting the data on a line graph supports visual analysis of changes in the amount, severity, or consistency of the behavior over time. (For more information, review the Graphing Data STAR Sheet.)
Tips for Implementation
- To simplify the collection of data, try using one of these strategies:
- Frequency data—Make tally marks on paper, use a small handheld counter, or put a handful of small items (e.g., pennies, paper clips) in one pocket and move one item to the other pocket each time the behavior occurs.
- Interval data—Use a stopwatch, smartphone app, or vibrating wearable device to signal the end of an interval and prompt you to record data.
- Duration or latency data—Use a digital stopwatch to collect data in minutes and seconds; using a wall clock or wristwatch will not be as precise.
- Consider using technology tools (e.g., smartphone timers, mobile tally counter apps, web-based form-building tools) to make SDO data collection more feasible in a busy classroom.
- If you are unsure whether the behavior occurred (e.g., the student walks behind a bookshelf and cannot be seen), do not attempt to guess what happened. Document only what can be directly seen or heard.
- Add brief written notes about the nature of the observed behavior alongside the numerical data to provide additional description or context.
- Calculate rates, percentages, or averages as appropriate to allow comparisons of data across observation periods of differing lengths. The chart below provides helpful calculations for each SDO method.
| Method | Calculation | Formula | Example |
| Frequency | Rate of the behavior | Rate = frequency count ÷ length of observation | 25 callouts ÷ 1.5 hours = 16.7 callouts per hour |
| Interval | Percentage of intervals in which the behavior occurred | Percentage = number of intervals with behavior ÷ total number of intervals x 100 | 42 intervals with off-task behavior ÷ 60 total intervals x 100 = 70% of intervals with behavior |
| Duration | Percentage of time engaged in the behavior | Percentage = minutes engaged in the behavior ÷ total minutes observed x 100 | 6 min out of seat ÷ 20 min observed x 100 = 30% of time engaged in target behavior |
| Duration | Average length of behavioral instances | Average = sum of lengths ÷ number of instances | (2.2 min + 6.1 min + 3.5 min + 5.0 min) ÷ 4 instances = average length of 4.2 min |
| Latency | Average elapsed time | Average = sum of latency lengths ÷ number of instances | (23 sec + 90 sec + 49 sec) ÷ 3 instances = average elapsed time of 54 sec |
For Your Information
- Although educators can collect SDO data while teaching, doing so can be challenging to manage and can interfere with instruction.
- Selecting the correct recording method for the behavior being observed is essential. Inappropriate choices (e.g., using duration recording for short, frequent behaviors) can result in misrepresentation of behavior patterns and misleading data.
- Students sometimes behave differently if they know they are being observed or when a new person is in the classroom. Some ways to reduce this reactivity include observing other students at the same time, integrating the observer into the classroom at other times, and using discreet recording methods.
Alberto, P. A., Troutman, A. C., & Axe, J. B. (2022). Applied behavior analysis for teachers (10th ed.). Pearson.
Briesch, A. M., Volpe, R. J., & Floyd, R. G. (2018). School-based observation: A practical guide to assessing student behavior. Guilford Press.
Cooper, J. O., Heron, T. E., & Heward, W. L. (2020). Applied behavior analysis (3rd ed.). Pearson.
Elswick, S., Casey, L. B., Zanskas, S., Black, T., & Schnell, R. (2016). Effective data collection modalities utilized in monitoring the good behavior game: Technology-based data collection versus hand collected data. Computers in Human Behavior, 54, 158–169. doi:10.1016/j.chb.2015.07.059
Hill, E., Volpe, R. J., & Briesch, A. M. (2023). Psychometric properties of the classroom observation of engagement, disrespectful and disruptive behaviors. School Psychology Review, 52(6), 735–746. doi:10.1080/2372966X.2021.2001692
Hojnoski, R. L., Missall, K. N., & Wood, B. K. (2020). Measuring engagement in early education: Preliminary evidence for the behavioral observation of students in schools—Early education. Assessment for Effective Intervention, 45(4), 243–254. doi:10.1177/1534508418820125
Lane, J. D., & Ledford, J. R. (2014). Using interval-based systems to measure behavior in early childhood special education and early intervention. Topics in Early Childhood Special Education, 34(2), 83–93. doi:10.1177/0271121414524063
LeBlanc, L. A., Lund, C., Kooken, C., Lund, J. B., & Fisher, W. W. (2020). Procedures and accuracy of discontinuous measurement of problem behavior in common practice of applied behavior analysis. Behavior Analysis in Practice, 13(2), 411–420. doi:10.1007/s40617-019-00361-6
Ledford, J. R., Ayres, K. M., Lane, J. D., & Lam, M. F. (2015). Identifying issues and concerns with the use of interval-based systems in single case research using a pilot simulation study. Journal of Special Education, 49(2), 104–117. doi:10.1177/0022466915568975
Lewis, T. J., Scott, T. M., Wehby, J. H., & Wills, H. P. (2014). Direct observation of teacher and student behavior in school settings: Trends, issues and future directions. Behavioral Disorders, 39(4), 190–200. doi:10.1177/019874291303900404
Lohmann, M. J., Riggleman, S., & Higgins, J. P. (2024). Using a mobile device for early childhood classroom behavior data collection. Early Childhood Education, 52, 427–434. doi:10.1007/s10643-023-01443-5
Yoder, P. J., Ledford, J. R., Harbison, A. L., & Tapp, J. T. (2018). Partial-interval estimation of count: Uncorrected and Poisson-corrected error levels. Journal of Early Intervention, 40(1), 39–51. doi:10.1177/1053815117748407
Zakszeski, B. N., Hojnoski, R. L., & Wood, B. K. (2017). Considerations for time sampling interval durations in the measurement of young children’s classroom engagement. Topics in Early Childhood Special Education, 37(1), 42–53. doi:10.1177/0271121416659054
STAR Sheet
Scatterplot Recording
About the Strategy
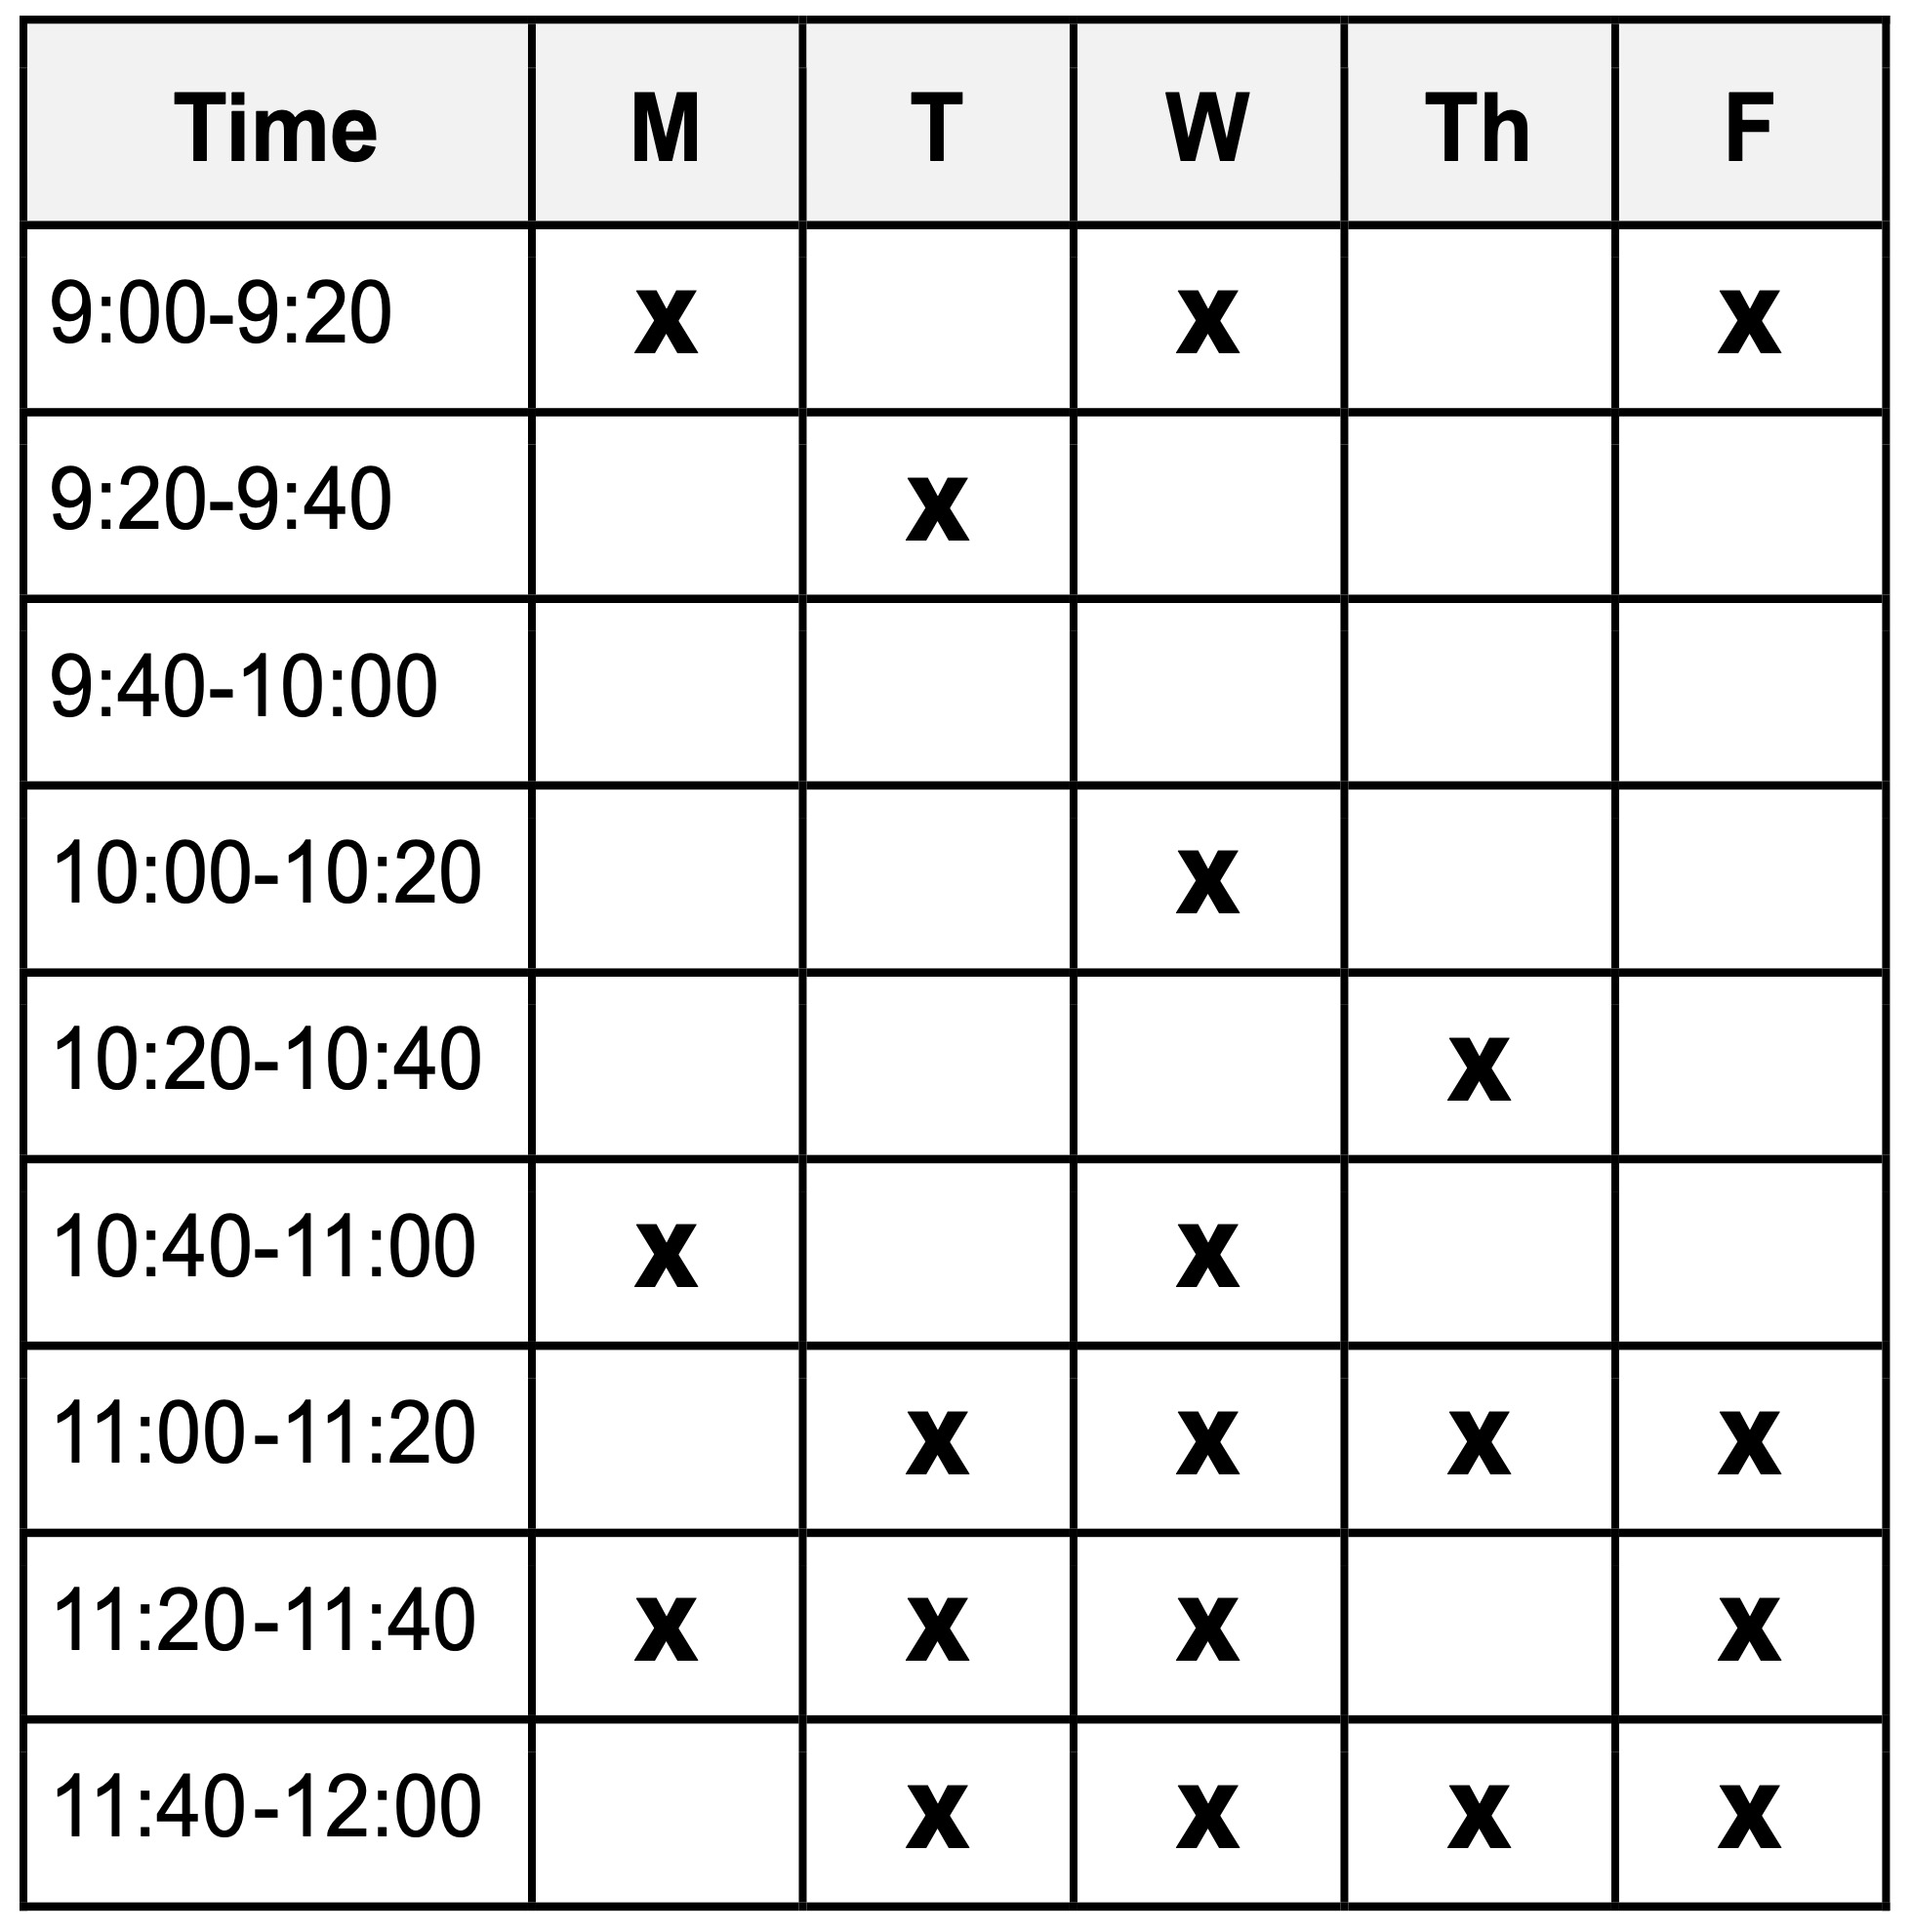 Scatterplot recording is a visual method used to analyze behavioral patterns over time. In this approach, the school day is divided into equal time intervals, and the educator records whether a given target or replacement behavior occurred during each interval.
What the Research and Resources Say
- Plotting scatterplot data can help reveal relationships between a behavior and a time of day, an activity, a social grouping, a physical environment, the presence of certain people, or a combination of such variables (Alberto et al., 2022).
- Scatterplot recording is most practical for easily observable, high-intensity behaviors (e.g., loud vocalizations, property destruction) that occur sporadically throughout the school day (Delgado et al., 2017; Robinson et al., 2019).
- Scatterplot data are especially useful when a behavior’s cause is not immediately obvious through informal observation (Robinson et al., 2019).
- Educators can collect scatterplot data while they are teaching, without disrupting classroom routines (Alberto et al., 2022).
- In the functional behavioral assessment (FBA) process, educators can use scatterplot data to pinpoint peak times for the behavior. Then direct observations can be scheduled during those periods to gather deeper insights (Anderson et al., 2015).
functional behavioral assessment (FBA)
glossary
Steps for Implementation
After identifying and operationally defining the behavior to be measured, use the steps outlined below to collect scatterplot data.
- Create an observation schedule: The school day should be divided into consistent intervals of time (e.g., 15 minutes, 30 minutes). It is often beneficial to align these intervals with the instructional schedule, which allows recording to occur during natural transitions.
- Use shorter intervals for behaviors that occur frequently.
- Use longer intervals for behaviors that occur less often but are intense or dangerous (e.g., elopement, meltdowns) that rarely occur.
x
elopement
glossary
- Select or develop a recording form: Recording forms are typically set up as a grid with columns representing days of the week and rows representing time intervals. Forms should also include a key to indicate whether and how often the behavior was observed, as illustrated in the sample scatterplot recording form below.
Scatterplot Recording Form
Directions
- Complete the information for the student and target behavior. Also, fill in the table with the time intervals, activities, and dates.
- At the end of each time interval, use the key to mark the behavior’s occurrence in the table.
- Calculate the percentage of days and intervals in which the behavior occurred.
Student: Taylor
Date: September 30 – October 4, 20XX
Target Behavior: Taylor produces one or more unprompted vocalizations louder than conversation level (e.g., shouting, shrieking) for any length of time.
| Time | Activity | Mon | Tues | Wed | Thurs | Fri | % of Days |
| 8:20–8:40 | Arrival | Did Not Occur | Did Not Occur | Did Not Occur | Did Not Occur | Did Not Occur | 0% |
| 8:40–9:00 | Morning work | Occurred 2 or More Times | Did Not Occur | / | Did Not Occur | / | 60% |
| 9:00–9:20 | Reading whole group | Did Not Occur | Did Not Occur | Did Not Occur | Did Not Occur | / | 20% |
| 9:20–9:40 | Reading whole group | Did Not Occur | / | / | Did Not Occur | Did Not Occur | 40% |
| 9:40–10:00 | Reading small group | Did Not Occur | Did Not Occur | Did Not Occur | Did Not Occur | Did Not Occur | 0% |
| 10:00–10:20 | Reading small group | Did Not Occur | Did Not Occur | Did Not Occur | Did Not Occur | Did Not Occur | 0% |
| 10:20–10:40 | Reading independent | Did Not Occur | Did Not Occur | / | Did Not Occur | Did Not Occur | 20% |
| 11:20–11:40 | Math whole group | / | Occurred 2 or More Times | Occurred 2 or More Times | / | Occurred 2 or More Times | 100% |
| 11:40–12:00 | Math small group | Occurred 2 or More Times | / | Did Not Occur | Occurred 2 or More Times | Occurred 2 or More Times | 80% |
| 12:00–12:20 | Math independent | Occurred 2 or More Times | Occurred 2 or More Times | / | / | / | 100% |
| 12:20–12:40 | Lunch | / | Occurred 2 or More Times | Occurred 2 or More Times | / | Did Not Occur | 80% |
| 12:40–1:00 | Lunch | Did Not Occur | Did Not Occur | / | / | Did Not Occur | 40% |
| 1:00–1:20 | Electives | Did Not Occur | Did Not Occur | / | Did Not Occur | Did Not Occur | 20% |
| 1:20–1:40 | Electives | Did Not Occur | Did Not Occur | Occurred 2 or More Times | Did Not Occur | Did Not Occur | 20% |
| 1:40–2:00 | Science instruction | Did Not Occur | / | Did Not Occur | / | / | 60% |
| 2:00–2:20 | Science activity | Did Not Occur | Did Not Occur | Did Not Occur | Did Not Occur | Did Not Occur | 0% |
| 2:20–2:40 | Writing | Did Not Occur | Did Not Occur | Did Not Occur | / | Did Not Occur | 20% |
| 2:40–3:00 | Snack | Did Not Occur | Did Not Occur | Did Not Occur | Did Not Occur | Did Not Occur | 0% |
| 3:00–3:20 | Independent work | Did Not Occur | / | Did Not Occur | Did Not Occur | Did Not Occur | 20% |
| 3:20–3:40 | Dismissal | Occurred 2 or More Times | Occurred 2 or More Times | Occurred 2 or More Times | Occurred 2 or More Times | Occurred 2 or More Times | 100% |
| % of Intervals | 30% | 40% | 50% | 35% | 35% | Empty | |
Key:
Did Not Occur
Occurred 1 Time
Occurred 2 or More Times
This template was adapted from Alberto et al. (2022) and Walker and Barry (2022).
- Conduct observations: Throughout the school day, the educator monitors the student’s defined behavior while continuing usual teaching activities.
- Record the behavior’s occurrence: At the end of each time interval, the educator marks whether the behavior occurred on the recording form created in Step 2. Data can be marked on paper forms, computerized systems, or mobile apps.
- Organize the data: The data should be organized in a way that supports interpretation and decision-making. The visual recording sheets often make it easy to see patterns that reflect when the behavior does and does not occur.
Tips for Implementation
- For more detailed data, consider using a key to further clarify the behavior’s frequency. For example, you might use a slash mark to indicate that the behavior occurred once during an interval but mark an X if it happened two or more times.
- To avoid confusion, clearly mark intervals in which the student was not observed and differentiate it from intervals when the behavior did not occur.
- Set a timer for the interval length or an alarm for the ending time of each interval as a reminder to mark the recording sheet.
- To summarize the data, calculate the percentage of intervals during which the behavior was observed for each day of the week or across a full week. For example:
- On Monday, the behavior occurred in 8 out of 12, or 67%, of intervals.
- Across a week, the behavior occurred in the 9:30 a.m.–10:00 a.m. interval on 3 out of 5, or 60%, of the days.
- Once a reliable pattern has emerged in the scatterplot data, consider recording more detailed antecedent-behavior-consequence (ABC) data during the times of day the behavior is most likely to occur. ABC data can help educators more fully understand what antecedent might be triggering and what consequence might be reinforcing the behavior.
For Your Information
- Although marking a box on the scatterplot takes only a few seconds, the educator must remain constantly attentive to the student’s behavior throughout the full interval to capture the data accurately.
- Interval lengths should be practical to manage but precise enough to show how the behavior changes across different daily contexts. Using time intervals that are too short can make recording overly time-consuming for educators. However, using time intervals that are too long can cause scatterplots to overestimate how often a behavior occurs.
- The patterns revealed by scatterplot data can help educators narrow down the times of day, activities, or environments that correlate with the behavior. Then they can proactively adjust these factors to support behavioral change.
Alberto, P. A., Troutman, A. C., & Axe, J. B. (2022). Applied behavior analysis for teachers (10th ed.). Pearson.
Anderson, C. M., Rodriguez, B. J., & Campbell, A. (2015). Functional behavior assessment in schools: Current status and future directions. Journal of Behavioral Education, 24, 338–371. doi:10.1007/s10864-015-9226-z
Briesch, A. M., Volpe, R. J., & Floyd, R. G. (2018). School-based observation: A practical guide to assessing student behavior. Guilford Press.
Cooper, J. O., Heron, T. E., & Heward, W. L. (2020). Applied behavior analysis (3rd ed.). Pearson.
Delgado, C., Gonzalez-Gordon, R. G., Aragón, E., & Navarro, J. I. (2017). Different methods for long-term systematic assessment of challenging behaviors in people with severe intellectual disability. Frontiers in Psychology, 8, Article 17. doi:10.3389/fpsyg.2017.00017
Institute on Community Integration. (n.d.). Direct observation: Scatter plot. https://publications.ici.umn.edu/dhs/positive-approaches-to-challenging-behaviors/direct-observation-scatter-plot
Kahng, S., Iwata, B. A., Fischer, S. M., Page, T. J., Treadwell, K. R., Williams, D. E., & Smith, R. G. (1998). Temporal distributions of problem behavior based on scatter plot analysis. Journal of Applied Behavior Analysis, 31(4), 593–604. doi:10.1901/jaba.1998.31-593
Los Angeles Unified School District. (n.d.). Data collection methods: Reference guide.
Robinson, J., Gershwin, T., & London, D. (2019). Maintaining safety and facilitating inclusion: Using applied behavior analysis to address self-injurious behaviors within general education classrooms. Beyond Behavior, 28(3), 154–167. doi:10.1177/1074295619870473
Symons, F. J., McDonald, L. M., & Wehby, J. H. (1998). Functional assessment and teacher collected data. Education and Treatment of Children, 21(2), 135–159.
Touchette, P. E., MacDonald, R. F., & Langer, S. N. (1985). A scatter plot for identifying stimulus control of problem behavior. Journal of Applied Behavior Analysis, 18(4), 343–351. doi:10.1901/jaba.1985.18-343
Walker, J. D., & Barry, C. (2022). Behavior management: Systems, classrooms, and individuals. Plural Publishing.
STAR Sheet
Graphing Data
About the Strategy
 Graphing data offers a visual picture of a student’s progress over time that is easier to interpret than a list of numbers or a stack of data recording sheets. Well-constructed graphs allow for ongoing analysis of progress and support communication among educators, students, families, and other professionals.
Although there are numerous types of graphs, line graphs are most often used to represent systematic direct observation (SDO) and Direct Behavior Rating (DBR) data. When using line graphs, educators plot data points over a given period, connect the adjacent plotted data points to create a line, and then interpret the shape of the connected line. Because scatterplot recording forms are inherently visual, it is usually not necessary to create an additional graph.
What the Research and Resources Say
- Although raw data can be difficult to interpret on its own, organizing data points on a graph helps educators visualize trends and make data-based decisions (Briesch et al., 2018; Davis & Akers, 2023).
- Visual analysis is most efficient when the graph is simple, uncluttered, and clearly labeled (Alberto et al., 2022; Kubina et al., 2021).
- Multiple school-based professionals (e.g., teachers, school psychologists, behavior analysts) should be involved in interpreting graphed data and making data-based decisions (Belmonte-Mulhall & Harrison, 2023; Jimenez et al., 2016).
Steps for Implementation
- Create a line graph. The grid for the line graph must be set up to align with the observation schedule and the nature of the data collected. It should include labels for both axes:
- The x-axis—the horizontal line at the bottom of the graph—represents time (e.g., days, observation sessions, class periods).
- The y-axis—the vertical line on the left side of the graph—represents the quantitative measurement of the behavior (e.g., rate, percentage of intervals, percentage of observation session, DBR rating).
- Plot the data on the graph. Data is transferred to the graph by plotting a point to represent the behavioral occurrence at each time. For example, if frequency data show that a student engaged in a target behavior seven times during Observation Session 1, a point would be plotted at (1, 7) on the graph. A solid line is then drawn to connect each point to the next.
- Analyze the data. Once the line graph has been constructed, it can be visually analyzed to identify:
- Level—the behavior’s overall magnitude (e.g., high, moderate, low)
- Trend—whether the behavior is increasing, decreasing, or staying the same over time
- Variability—how consistent or fluctuating the rate of the behavior is
Based on this visual analysis, educators can determine the effectiveness of current supports and interventions and make adaptations if needed.
Tips for Implementation
- To obtain an accurate reflection of student performance, aim for at least six to eight data points before analyzing the graph. Daily behavior can fluctuate due to factors like illness or fatigue, making a greater number of data points essential to minimize outliers and related misinterpretation.
- To facilitate ongoing visual analysis of emerging trends, set up the graph early and plot data points as they are collected, rather than waiting to graph a large batch of data.
- If data are being collected on multiple behaviors simultaneously and both use the same type of measurement, represent both on the same line graph. Use a different geometric symbol (e.g., circle, triangle, square) for each behavior, and provide a key to clearly denote which line represents which behavior. Review the example below.

- Consider using spreadsheet software or web-based tools to transform raw data into line graphs. Such tools can be much more efficient than graphing by hand and reduce the likelihood of human error.
For Your Information
Raw data often needs to be standardized before plotting to ensure accurate analysis. For instance, frequency data—the number of times a behavior occurs within a given period—cannot be directly compared across unequal observation periods (e.g., 20 versus 30 minutes). But when these counts are converted into a rate, such as occurrences per minute, the time difference no longer matters, and the data can be accurately graphed and compared.
Tiered Systems
Graphed data can help educators interpret a student’s responsiveness to interventions within a tiered system, such as PBIS. Before introducing a behavioral support or intervention, baseline data are collected to capture the typical nature of the behavior. Data collection continues throughout the intervention phase, following the same procedures established during baseline. As shown below, a line graph supports visual comparison of the two conditions by:
baseline data
glossary
- Using a dotted vertical line to separate the baseline phase and the intervention phase
- Clearly labeling the baseline and intervention phase
- Omitting the connecting line between the last baseline point and the first intervention point

Alberto, P. A., Troutman, A. C., & Axe, J. B. (2022). Applied behavior analysis for teachers (10th ed.). Pearson.
Belmonte-Mulhall, C. P., & Harrison, J. R. (2023). Multi-tiered systems of support: A pilot study of teacher interpretation and application of graphed behavioral data. Journal of Applied School Psychology, 39(2), 151–178. doi:10.1080/15377903.2022.2113945
Briesch, A. M., Volpe, R. J., & Floyd, R. G. (2018). School-based observation: A practical guide to assessing student behavior. Guilford Press.
Collins, B. C. (2022). Systematic instruction for students with moderate and severe disabilities (2nd ed.). Brookes Publishing.
Davis, T. N., & Akers, J. S. (2023). A behavior analyst’s guide to supervising fieldwork. Springer.
Hojnoski, R. L., Gischlar, K. L., & Missall, K. N. (2009). Improving child outcomes with data-based decision making: Collecting data. Young Exceptional Children, 12(3), 32–44. doi:10.1177/1096250609333025
Jimenez, B. A., Mims, P. J., & Baker, J. (2016). The effects of an online data-based decisions professional development for in-service teachers of students with significant disability. Rural Special Education Quarterly, 35(3), 30–40. doi:10.1177/875687051603500305
Kubina, R. M., Kostewicz, D. E., King, S. A., Brennan, K. M., Wertalik, J., Rizzo, K., & Markelz, A. (2021). Standards of graph construction in special education research: A review of their use and relevance. Education and Treatment of Children, 44(4), 275–290. doi:10.1007/s43494-021-00053-3
Mandinach, E. B. (2012). A perfect time for data use: Using data-driven decision-making to inform practice. Educational Psychologist, 47, 71–85. doi:10.1080/00461520.2012.667064
Wolfe, K., McCammon, M. N., LeJeune, L. M., & Holt, A. K. (2023) Training preservice practitioners to make data-based instructional decisions. Journal of Behavioral Education, 32, 1–20. doi:10.1007/s10864-021-09439-0
Case
Level A • Case 1
Background
Student: Malachi
Age: 12
Grade: 6th
Scenario
Malachi is an outgoing student who is often described as the class clown. Malachi frequently disrupts the class with verbal comments, noises, and jokes, seemingly to gain peer attention. For example, Malachi has made numerous derogatory comments about his math teacher behind her back and simulated flatulence noises during instruction. One day when Malachi’s science teacher stepped out of the room, Malachi put on glasses and mocked the teacher’s mannerisms, leading to widespread laughter and loud talking among the whole class.
Within the first three months of school, Malachi has received numerous warnings and phone calls home about his behavior. Furthermore, he has been referred to the office 12 times already. Malachi’s teachers are worried that his behavior will escalate as the winter holidays draw closer. They need to determine a method that will help them collect information on Malachi’s disruptive behavior.
Possible Strategies
- Direct Behavior Rating
- Systematic Direct Observation
Assignment
- Read the Introduction and the STAR Sheets for the strategies listed above.
- Malachi’s teachers consider using DBR as a method of data collection.
- Define DBR.
- Outline the steps that Malachi’s teachers would need to take to prepare for collecting DBR data.
- The teachers also consider collecting SDO data.
- Define SDO.
- Identify one specific method of SDO data collection that would be appropriate for measuring Malachi’s behavior. Explain why.
- For each method, name one benefit of using this approach to collect data on Malachi’s behavior.
Case
Level A • Case 2
Background
Student: Teagan
Age: 10
Grade: 4th
Scenario
Teagan rarely finishes her classwork because she is frequently out of her seat wandering the classroom. During a typical lesson, she will walk away from her desk to look at a display across the room, drift over to the cubbies to rummage through her backpack, and make multiple trips to the pencil sharpener. These trips add up quickly, leaving her with barely any time to look at her assignments.
Teagan’s teacher, Ms. Lowe, feels like she is constantly telling Teagan to return to her desk and get back to work. Monitoring and redirecting Teagan takes a great deal of Ms. Lowe’s time and energy, especially because she does not have a paraeducator in the classroom. Ms. Lowe is frustrated, but she realizes that she doesn’t have a clear, objective picture of Teagan’s behavior. Before she can decide how to best intervene, she needs to collect data to help her understand the nature and severity of the behavior. Recognizing the difficulty of doing so while actively teaching, she contacts the school’s behavior specialist to collaborate on an observation and data collection plan.
Strategies
- Systematic Direct Observation
- Graphing Data
Assignment
- Read the Introduction and the STAR Sheet for the strategy listed above.
- Define the four types of SDO data.
- Identify which type of SDO data you would recommend to Ms. Lowe for measuring Teagan’s out-of-seat behavior. Explain why.
- Identify a type of SDO data that would be inappropriate for measuring Teagan’s out-of-seat behavior. Explain why.
- Ms. Lowe develops a line graph to visually organize the data collected using the SDO method chosen in Question 2a. When setting up the graph, describe how she should label the x-axis and the y-axis and what each would represent.
Case
Level A • Case 3
Background
Student: Rohan
Age: 7
Grade: 2nd
Scenario
Rohan, a student in Ms. Clark’s second-grade class, loves animals, nature, and playing sports. He has always seemed to enjoy school but has started to display more academic difficulty this year. Ms. Clark is growing increasingly concerned that Rohan seems to be finding ways to avoid his classwork, such as putting his head down on the desk, spending extended time looking for materials, and even dropping to the floor and refusing to work.
When the principal asks Ms. Clark about Rohan’s behavior, she explains that it doesn’t happen all day or during all activities, but she can’t quite pin down a pattern. Together, they decide that collecting data in a scatterplot could help determine if the behavior is tied to a specific subject, activity, or time of day.
They write the following operational definition of Rohan’s behavior:
Description: Rohan engages in actions unrelated to the assigned instructional task for at least 30 seconds.
Examples
- Rohan buries his head in his arms for at least 30 seconds.
- Rohan rummages through items in his backpack for more than 30 seconds when all needed materials are already available.
- Rohan sits on the floor under his desk without any task-related materials for at least 30 seconds.
Non-Examples
- Rohan crawls under his desk to retrieve a dropped pencil and returns to the task.
- Rohan stops writing, stares at the word wall across the room for 45 seconds, then writes the word he was referencing.
- Rohan lays his head down on his desk for 15 seconds before lifting it and returning to his work.
Ms. Clark records data on Rohan’s behavior during all instructional times for one week, as shown below.
Student: Rohan
Target Behavior: Rohan engages in actions unrelated to the assigned instructional task for at least 30 seconds.
| Time | Activity | Mon | Tues | Wed | Thurs | Fri | % of Days |
| 8:30–8:45 | Morning work | Did Not Occur | Did Not Occur | Did Not Occur | / | Did Not Occur | 20% |
| 8:45–9:00 | Morning meeting | Did Not Occur | Did Not Occur | Did Not Occur | Did Not Occur | Did Not Occur | 0% |
| 9:00–9:15 | ELA whole group | / | / | Did Not Occur | Occurred 2 or More Times | / | 80% |
| 9:15–9:30 | ELA whole group | Occurred 2 or More Times | / | / | Occurred 2 or More Times | Occurred 2 or More Times | 100% |
| 9:30–9:45 | ELA small group | Did Not Occur | Did Not Occur | Did Not Occur | / | Did Not Occur | 20% |
| 9:45–10:00 | ELA small group | Did Not Occur | / | Did Not Occur | / | Did Not Occur | 40% |
| 10:00–10:15 | ELA independent work | Occurred 2 or More Times | Occurred 2 or More Times | Occurred 2 or More Times | Occurred 2 or More Times | Occurred 2 or More Times | 100% |
| 12:00–12:15 | Math whole group | Did Not Occur | Did Not Occur | Did Not Occur | / | Did Not Occur | 20% |
| 12:15–12:30 | Math whole group | Did Not Occur | Did Not Occur | Did Not Occur | Occurred 2 or More Times | / | 40% |
| 12:30–12:45 | Math small group | Did Not Occur | Did Not Occur | Did Not Occur | / | Did Not Occur | 20% |
| 12:45–1:00 | Math stations | / | Did Not Occur | Did Not Occur | Occurred 2 or More Times | / | 60% |
| 1:15–1:30 | Science | Did Not Occur | Did Not Occur | Did Not Occur | Did Not Occur | Did Not Occur | 0% |
| 1:30–1:45 | Science | Did Not Occur | Did Not Occur | Did Not Occur | Did Not Occur | Did Not Occur | 0% |
| 1:45–2:00 | Science | Did Not Occur | Did Not Occur | Did Not Occur | / | Did Not Occur | 20% |
| 2:00–2:15 | Independent reading | Occurred 2 or More Times | Occurred 2 or More Times | Occurred 2 or More Times | Occurred 2 or More Times | Occurred 2 or More Times | 100% |
| % of Intervals | 33% | 33% | 20% | 80% | 40% | Empty | |
Key:
Did Not Occur
Occurred 1 Time
Occurred 2 or More Times
Possible Strategies
- Direct Behavior Rating
- Systematic Direct Observation
- Scatterplot Recording
Assignment
- Read the Introduction and the STAR Sheets for the strategies listed above.
- Which method did Ms. Clark use for data collection? Why do you think she selected this method?
- Look at the chart displaying Rohan’s data.
- What do the rows (labeled top to bottom) represent?
- What do the columns (labeled left to right) represent?
- How many times did the target behavior occur during Math Stations on Friday?
- How many times did the target behavior occur between 8:45 a.m. and 9:00 a.m. on Tuesday?
- Based on the data, when did Rohan’s target behavior occur most often?
Case
Level B • Case 1
Background
Student: Ava
Age: 6
Grade: Kindergarten
Scenario
Ava is a kindergarten student with autism who spends most of her school day in an inclusive classroom. Although Ava can communicate using one- and two-word utterances, she primarily uses picture cards to communicate her wants and needs. Ava has recently begun to demonstrate significant behaviors that disrupt the learning environment and pose safety concerns. She yells “No!,” tears up worksheets, and occasionally pinches or hits peers. Ava’s teacher, Mrs. Pritchard, and full-time paraeducator, Ms. Cox, have noticed that these behaviors seem to occur most frequently when Ava is asked to transition from one activity to another.
Ava’s individualized education program (IEP) team initiated a functional behavioral assessment (FBA) to explore the function of Ava’s behavior. They wrote the following operational definition of the behavior:
Description: Any instance of loud verbalization or forceful physical action directed at materials or other people.
Examples
- Yelling “No!” at a high volume
- Ripping pages from a workbook
- Sweeping materials off a table
- Pinching a peer’s arm
- Striking a peer with an open hand
Non-Examples
- Handing a “No, thank you” picture card to the teacher
- Moving a worksheet to the side and laying head on desk
- Bumping into a peer while walking in line
- Tapping a peer on the shoulder to gain their attention
The information gathered from informal assessments and antecedent-behavior-consequence (ABC) data suggest that the function of the behavior is to avoid the termination of a preferred activity. The team decides to introduce a visual schedule and a visual timer to support Ava during transitions, but they first need to collect baseline data on the behavior.
Possible Strategies
- Systematic Direct Observation
- Direct Behavior Rating
- Scatterplot Recording
Assignment
- Read the Introduction and the STAR Sheets for the strategies listed above.
- Describe how the operational definition of Ava’s target behavior is observable, measurable, and actively stated.
- Identify which of the three possible data collection strategies you would use to collect data on Ava’s behavior.
- Explain why you chose this method.
- Explain the specific steps Ava’s team would need to take to prepare for collecting data using this method.
- Explain how the team could organize and visually analyze the data once collected.
Case
Level B • Case 2
Background
Student: Cyrus
Age: 16
Grade: 10th
Scenario
Cyrus, a high school sophomore, has struggled with maintaining safe, productive habits during his chemistry lab blocks. Because these labs involve hazardous materials and strict procedures, Cyrus’s teacher, Mr. Ramirez, wants to prioritize increasing his safe and on-task behavior, including handling materials appropriately, remaining at his designated station, and following written instructions.
To track Cyrus’s progress, Mr. Ramirez decides to use a DBR scale representing the estimated proportion of the total class time that Cyrus spends safely engaged in his tasks. He begins by collecting baseline data for one week:
- Monday (Day 1): 35% of the lab period spent safely on task
- Tuesday (Day 2): 50% of the lab period spent safely on task
- Wednesday (Day 3): 20% of the lab period spent safely on task
- Thursday (Day 4): 45% of the lab period spent safely on task
- Friday (Day 5): 30% of the lab period spent safely on task
To address the low baseline data, Mr. Ramirez implements an intervention at the start of Week 2. Cyrus is given a step-by-step checklist of lab safety rules, setup instructions, and cleanup tasks. Mr. Ramirez continues to collect DBR data over the next five days:
- Monday (Day 6): 55% of the lab period spent safely on task
- Tuesday (Day 7): 65% of the lab period spent safely on task
- Wednesday (Day 8): 70% of the lab period spent safely on task
- Thursday (Day 9): 75% of the lab period spent safely on task
- Friday (Day 10): 70% of the lab period spent safely on task
Possible Strategies
- Direct Behavior Rating
- Graphing
Assignment
- Read the Introduction and the STAR Sheets for the strategies listed above.
- Provide two reasons why DBR is an effective way for Mr. Ramirez to collect data on Cyrus’s behavior.
- Construct a line graph of Cyrus’s progress monitoring data, making sure to include all relevant components and labels. Download a blank graph.
- Visually analyze the graph.
- What do you notice in terms of level, trend, and variability?
- How does Cyrus seem to be responding to the intervention?
Case
Level C • Case 1
Background
Student: Daniela
Age: 14
Grade: 8th
Scenario
Mr. Smith teaches history at Hamilton High School. Because his students have a wide range of reading abilities, he often reads a paragraph from the text aloud and then asks listening comprehension questions. During this question-and-answer period, students are required to raise their hands and wait to be called on.
Daniela, a new transfer student, frequently talks to peers and writes notes to friends during this activity. When she does respond to questions, she blurts out the answer without waiting to be called on. Though her answers are always correct, Mr. Smith is frustrated with her behavior.
Concerned about this pattern of behavior, Mr. Smith asks the school psychologist, Mrs. Patel, to observe Daniela and record data on her behavior. She decides to observe for 10 to 20 minutes each day and collect frequency data on the number of times Daniela calls out as well as interval data on Daniela’s off-task actions. Mrs. Patel collects data for a one-week baseline period (review data samples below).
Frequency Data: Summary Table
Behavior: Daniela verbally states a response or answer to a question without first seeking and receiving explicit permission to speak.
| Date | Time Start | Time End | Total Time | Tally | Total Occurrences | Rate |
| 3/13/20xx | 2:15 p.m. | 2:25 p.m. | 10 min |  |
4 | 4 ÷ 10 min = 0.4/min |
| 3/14/20xx | 2:16 p.m. | 2:26 p.m. | 10 min | |
5 | Empty |
| 3/15/20xx | 2:15 p.m. | 2:35 p.m. | 20 min | |
8 | Empty |
| 3/16/20xx | 2:17 p.m. | 2:27 p.m. | 10 min |  |
6 | Empty |
| 3/17/20xx | 2:15 p.m. | 2:35 p.m. | 20 min |  |
11 | Empty |
Interval Data: Summary Table
Behavior: Daniela directs attention to materials, activities, or peer conversations that are unrelated to the current instructional task for 3 consecutive seconds or longer.
| Date | Time Start | Time End | % of intervals |
| 3/13/20xx | 2:15 p.m. | 2:25 p.m. | 60% |
| 3/14/20xx | 2:16 p.m. | 2:26 p.m. | 75% |
| 3/15/20xx | 2:15 p.m. | 2:35 p.m. | 63% |
| 3/16/20xx | 2:17 p.m. | 2:27 p.m. | 70% |
| 3/17/20xx | 2:15 p.m. | 2:35 p.m. | Empty |
Interval Recording Form
Directions: Circle “+” for occurrence of behavior and “–” for nonoccurrence of behavior. Count the number of intervals during which the behavior occurred. Divide this number by the total number of intervals and multiply by 100 to determine the percentage of intervals during which the behavior occurred.
Student: Daniela
Class/Teacher: 2nd period history/Mr. Smith
Start/End Times: 2:25 – 2:35 p.m.
Date: 3/17/20xx
Observer: Mrs. Patel
Length of Interval: 30 sec
Behavior: Daniela directs attention to materials, activities, or peer conversations that are unrelated to the current instructional task for 3 consecutive seconds or longer.
| Interval | Behavior | Interval | Behavior |
| 1 | – | 21 | + |
| 2 | – | 22 | – |
| 3 | + | 23 | + |
| 4 | – | 24 | + |
| 5 | + | 25 | + |
| 6 | + | 26 | + |
| 7 | + | 27 | – |
| 8 | – | 28 | – |
| 9 | – | 29 | – |
| 10 | + | 30 | + |
| 11 | + | 31 | + |
| 12 | + | 32 | + |
| 13 | + | 33 | + |
| 14 | + | 34 | + |
| 15 | + | 35 | + |
| 16 | – | 36 | + |
| 17 | – | 37 | – |
| 18 | – | 38 | – |
| 19 | + | 39 | + |
| 20 | + | 40 | + |
| Empty | Empty | Total % | Empty |
Assignment
- Using the data provided, summarize the results.
- Calculate Daniela’s rate of calling out each day and record in the yellow-shaded boxes in the summary table.
- Calculate Daniela’s percentage of off-task behavior using the interval recording sheet for March 17. Record your result in the green-shaded box in the summary table.
- Analyze Daniela’s data. Are Mr. Smith’s concerns about Daniela’s calling out and off-task behavior justified? Why or why not?
- Mr. Smith decides to implement proactive instructional adjustments and positive reinforcement to try to increase Daniela’s academic engagement. After introducing this intervention, Mrs. Patel continues to conduct observations and records the data below.
| Date | Rate of callouts (times per min) | Percentage of intervals off task |
| 3/22/20xx | 0.5 | 33% |
| 3/23/20xx | 0.7 | 25% |
| 3/24/20xx | 0.4 | 30% |
| 3/27/20xx | 0.5 | 38% |
| 3/28/20xx | 0.3 | 35% |
- Construct two line graphs, one displaying the rate of Daniela’s calling out and the other displaying the percentage of time spent off task. Make sure to represent both baseline and intervention data and include all relevant components and labels. Download a blank graph.
- Visually analyze the graphs. Describe the level, variability, and trend of each behavior.
- Is Daniela responding to the intervention? Should Mr. Smith continue, adapt, or stop the intervention?
To cite this case study unit, please use the following:
IRIS Center. (2012, 2026). Measuring behavior. Retrieved from http://iris.peabody.vanderbilt.edu/wp-content/uploads/pdf_case_studies/ics_measbeh.pdf
The contents of this resource were developed under a grant from the U.S. Department of Education, #H325E220001. However, those contents do not necessarily represent the policy of the U.S. Department of Education, and you should not assume endorsement by the Federal Government. Project Officer, Anna Macedonia.
Credits
Content ContributorsSara C. Bicard Case Study DevelopersJordan Lukins EditorNicholas Shea |
ReviewersKim Skow GraphicsBrenda Knight WebmasterJohn Harwood ImagesShutterstock |
Licensure and Content Standards
This IRIS Case Study aligns with the following licensure and program standards and topic areas.
Council for Exceptional Children (CEC)
CEC standards encompass a wide range of ethics, standards, and practices created to help guide those who have taken on the crucial role of educating students with disabilities.
- Standard 4: Assessment
Interstate Teacher Assessment and Support Consortium (InTASC)
InTASC Model Core Teaching Standards are designed to help teachers of all grade levels and content areas to prepare their students either for college or for employment following graduation.
- Standard 6: Assessment
The Division for Early Childhood Recommended Practices (DEC)
The DEC Recommended Practices are designed to help improve the learning outcomes of young children (birth through age five) who have or who are at-risk for developmental delays or disabilities.
- Topic 5: Instruction
