What are the school’s responsibilities regarding assistive technology?
Page 7: Ongoing Monitoring of AT

Once the AT has been implemented, ongoing monitoring is necessary to determine whether it will continue to be beneficial over time. To accomplish this, the teacher needs to continue to collect performance data frequently (e.g., daily, weekly) over a period of time (e.g., six months). Next, these data must be graphed.
Performance data reflecting the student’s progress both with and without the use of the AT should be collected. Because the student should be allowed to use the AT in everyday tasks, teachers should make sure that there are no negative effects on student progress when collecting data without AT. As such, teachers can collect these data periodically (e.g., monthly). Note also that these data should be used only for evaluation purposes and not for grading.
Listen as Megan Mussano and Daniel Cochrane discuss the importance of ongoing monitoring.

Megan Mussano, MS CCC-SLP/L, ATP
Assistive Technology Coordinator, Illinois K-12 School District
Instructor, University of Wisconsin-Milwaukee and Aurora University
(time: 3:39)

Daniel Cochrane, MA, MS, ATP
Assistive Technology Specialist
Clinical Instructor, University of Illinois at Chicago
(time: 1:49)
Megan Mussano, MS CCC-SLP/L, ATP
It is essential to continue to monitor students’ use and success with assistive technology just as you would monitor their success and progress towards IEP goals. Well integrated assistive technology is written into the IEP, where the assistive tech often supports one of their goals. Whether it be a reading goal, writing goal, a communication goal, the assistive technology is often an integral part of that goal. So you continue to monitor assistive technology throughout the year as you monitor their other goals. We also want to reduce assistive tech abandonment. One of the main ways we can reduce abandonment is to make sure individuals are well trained. But we can also reduce abandonment by monitoring how successful the AT is. Sometimes AT is abandoned because the AT isn’t successful. So we as educators need to monitor the success of the AT to determine if it actually is helping the student. It may not be. Just because we like it doesn’t mean they like it. You’re monitoring the AT use as often and as frequently as you monitor the goal, which is maybe once a week, a couple of times a quarter, depending what your frequency of data collection is for your goal. It’s really integral in what the student’s doing every day. AT should not be its own separate category. AT should not be set aside, as an, ok, this is AT time where everything else is accomplished separately. It needs to be integrated into what the student does all day, every day so you really monitor it throughout the year. You monitor it as you monitor IEP goals and you determine its effectiveness throughout the year. So if the AT is helping the student access the curriculum, and if they’re becoming more successful students because of the AT, you continue to use it and you continue to monitor it throughout the year.
There’s times when a student has successful AT, and over the years that AT starts to become less successful. Why does this happen? Sometimes AT becomes less successful because individuals around the student aren’t well trained. It’s not supported. The student isn’t provided continual support to help make that assistive technology successful. That’s one reason. Another reason can actually be that the student’s own natural abilities have increased. If your student’s natural abilities increase, and your student grows and learns and improves through the use of AT, you’ve accomplished what you wanted. Initially, when a student is, for example, a poor speller or a poor reader, we can provide them audio books or we provide them a text-to-speech program. But as they continue to receive interventions and supports and actually grow their reading skills, we can often see students rely less on the audio books. Or if someone is a poor speller, as they receive interventions, they start to learn the process of spelling. They learn the rules. They become a better speller. If you have a student who needed a word-prediction program but as they go through the years and develop their innate abilities and develop their skills, you might be able to reduce the amount of support from a word-prediction program just to the spellcheck that’s built into a word processor. And I’m going to say consider it a win. If you can reduce the amount of AT needed and your student is still successful, you’re doing a great job.
Daniel Cochrane, MA, MS, ATP
Monitoring progress is important. The student may acquire new skills, but the task demands may also change because the environment changes over time. So with the principle that nothing stays the same, we need to rethink AT at least every year at the annual review before we tick the box yes and let all the past accommodations flow through. And I’m embarrassed to say that I have a story from my own work that nicely illustrates the importance of monitoring over time. I worked with a student when he was in 4th or 5th grade and we found word-prediction to be helpful. So we had data for it, and it was added to his IEP.
Years later, I was called into his IEP meeting in high school because the family advocate was insisting that the word-prediction, still listed in his IEP, should be provided. And, of course, she was right. But I was horrified to realize that what had happened was the AT written in 4th or 5th grade had flowed through his electronic IEP in the same wording that we had used in 5th grade. And it was now sitting here in his, I think, 10th-grade IEP, and it was never reassessed in middle school. And here was the kid in high school, a very different kid. Did he still need word-prediction? Well, maybe he did or maybe he didn’t, but how could the documentation from four or five years ago tell us anything?
Legally, of course, we had to provide the word-prediction until I could do a reassessment and get some data on what his current needs were. And word-prediction, by the way, was no longer needed because his spelling skills had come along, and he wasn’t really needing that level of support in his spelling.
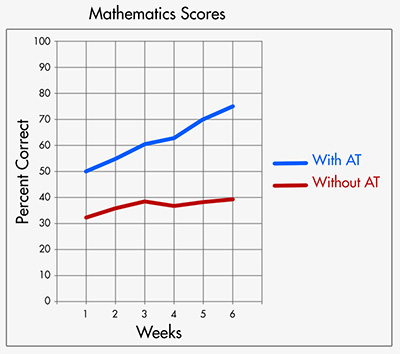
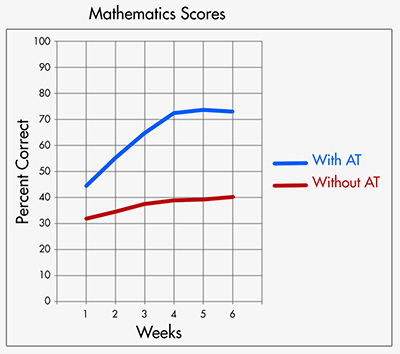
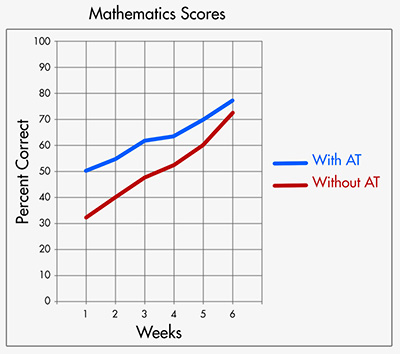
The student’s graphed data should be examined regularly to allow the IEP team to make decisions about the AT’s continued use. Several data patterns are illustrated below along with their corresponding decisions. Note that for the purpose of comparing a student’s performance with and without AT, it is acceptable to graph these two data lines on the same graph.
| Data Pattern | Decision |
|---|---|
 |
If there is a significant gap between the student’s performance with and without AT:
This graph is labeled “Mathematics Scores” and demonstrates student progress both with and without the implementation of AT devices or services. The y-axis is labeled “Percent Correct” with segments spanning from zero to 100 in ten-step increments. The x-axis is labeled “Weeks” with segments spanning from one to six in one-step increments. A red line indicates student progress without the use of AT devices or services, showing 31, 36, 39, 38, 39, and 40 percent correct, respectively. A blue line indicates student progress with the use of AT devices or services, showing 50, 55, 61, 62, 70, and 75 percent correct, respectively. |
 |
If the student’s performance with AT seems to flatten out or plateau:
This graph is labeled “Mathematics Scores” and demonstrates student progress both with and without the implementation of AT devices or services. The y-axis is labeled “Percent Correct” with segments spanning from zero to 100 in ten-step increments. The x-axis is labeled “Weeks” with segments spanning from one to six in one-step increments. A red line indicates student progress without the use of AT devices or services, showing 31, 35, 38, 39, 40, and 41 percent correct, respectively. A blue line indicates student progress with the use of AT devices or services, showing 46, 56, 66, 71, 73, and 72 percent correct, respectively. |
 |
If the student’s performance without AT is improving and approaching his or her expected level of performance:
This graph is labeled “Mathematics Scores” and demonstrates student progress both with and without the implementation of AT devices or services. The y-axis is labeled “Percent Correct” with segments spanning from zero to 100 in ten-step increments. The x-axis is labeled “Weeks” with segments spanning from one to six in one-step increments. A red line indicates student progress without the use of AT devices or services, showing 31, 40, 49, 51, 60, and 71 percent correct, respectively. A blue line indicates student progress with the use of AT devices or services, showing 50, 55, 61, 62, 70, and 78 percent correct, respectively. |
Revisiting the Challenge: Ongoing Monitoring of Brooke’s AT Use
 As the year progresses, Mr. Edward’s regularly checks in with the science and social studies teachers to determine whether the AT is still helpful for Brooke. He also communicates directly with Brooke and her family about her use of AT. By doing so, the teachers remain aware of her ongoing needs and what is working or not working for her in the classroom and at home.
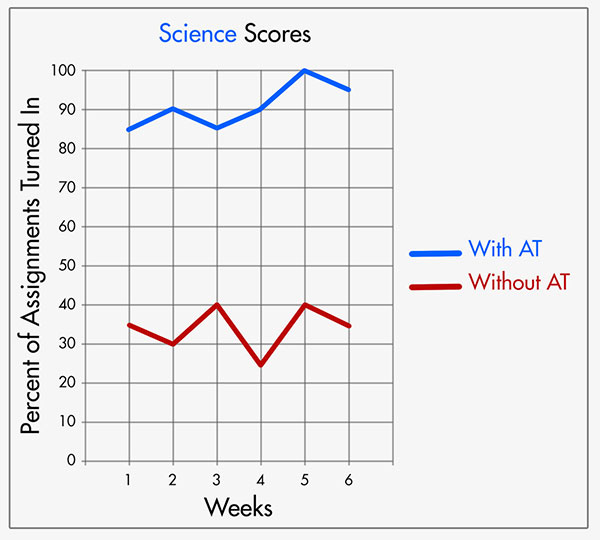
Both teachers continue to collect data on Brooke’s ability to turn in assignments on time. As depicted in the graph below, Brooke’s ability to turn in science assignments continues to increase with the use of AT. However, without AT, Brooke turns in assignments 40% of the time or less. These data indicate that Brooke is continuing to benefit from her AT. Similarly, the data collected by her social studies teacher indicates that Brooke continues to benefit from her AT.

Description
This graph is labeled “Science Scores” and demonstrates student progress both with and without the implementation of AT devices or services. The y-axis is labeled “Percent of Assignments Turned In” with segments spanning from zero to 100 in ten-step increments. The x-axis is labeled “Week” with segments spanning from one to six in one-step increments. A red line indicates student progress without the use of AT devices or services, showing 35, 30, 40, 25, 40, and 35 percent of assignments turned in, respectively. A blue line indicates student progress with the use of AT devices or services, showing 85, 90, 85, 90, 100, and 95 percent of assignments turned in, respectively.