How can school personnel intensify and individualize instruction?
Page 3: Intensifying and Individualizing Interventions
There are two steps in the DBI process at which point teachers can intensify and individualize instructional interventions, Step 1 and Step 4. Read more about them below.
- Step 1: Validated Intervention Program—Teachers should intensify the secondary intervention by making quantitative changes (e.g., increase amount of instructional time, decrease group size).
- Step 2: Progress Monitoring*
- Step 3: Diagnostic Assessment*
- Step 4: Intervention Adaptation—Following progress monitoring and a diagnostic assessment, teachers can adapt the intervention by making quantitative and/or qualitative changes (e.g., the way in which content is delivered).
- Step 5: Progress Monitoring*
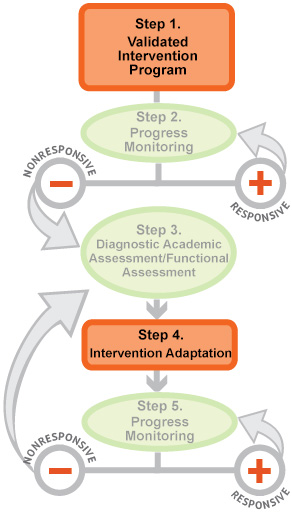
This graphic illustrates both the steps of data-based individualization, as well as they ways in which those steps interact. Step 1, “Validated Intervention Program,” is represented by an orange rectangle. This box connects via a vertical grey line to Step 2, “Progress Monitoring,” which is illustrated as a green oval. Both steps, in turn, are connected to a horizontal line with labeled circles at each of its ends. The circle on the left, “Nonresponsive,” has a red minus sign at its center, while the circle on the right, “Responsive,” has a red plus sign. A grey arrow connected to the “Nonresponsive” circle points toward Step 3 of the DBI process, “Diagnostic Academic Assessment/Functional Assessment,” which is represented as a green oval, similar to Step 2. The “Responsive” circle also has a grey arrow, this one pointing back up toward Step 2, “Progress Monitoring.”
Step 3 is connected via a vertical grey arrow to Step 4, “Intervention Adaptation,” represented as an orange rectangle. Another grey arrow connects Step 4 to Step 5, “Progress Monitoring,” another green oval. As above, these latter steps are connected to a horizontal line with labeled circles at each of its ends. The circle on the left, “Nonresponsive,” has a red minus sign at its center, while the circle on the right, “Responsive,” has a red plus sign. A large grey arrow connected to the “Nonresponsive” circle points back to Step 3, “Diagnostic Academic Assessment/Functional Assessment,” while the “Responsive” circle directs instructors back to Step 5, “Progress Monitoring.”
This module page focuses on Steps 1 and 4, so those orange boxes are highlighted whereas the rest of the graphic is slightly faded out.
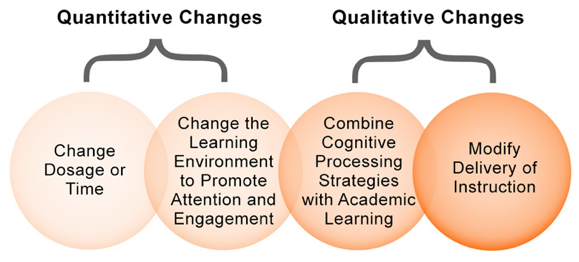
As the graphic below illustrates, there are four main ways to intensify or individualize an instructional intervention, ranging from the least intensive to the most intensive. The first two methods—”change dosage or time” and “change the learning environment”—are quantitative changes to instruction. These types of adaptations are recommended for Step 1 of the DBI process and can also be used in Step 4. The other two methods of adapting instruction—”combine cognitive processing strategies with academic learning” and “modify delivery of instruction”—are qualitative changes to instruction that are typically used in Step 4. To meet a student’s needs, the teacher might choose to use a combination of quantitative and qualitative adaptations in Step 4 based on the results of a diagnostic assessment in Step 3.
Vaughn, et al., 2013
This graphic represents the four main ways to intensify or individualize an instructional intervention, ranging from the least intensive to the most intensive. There are two quantitative changes and two qualitative ones, all represented as overlapping circles. Increasing intensification is represented by darkening colors; the circles start off light pink on the left and turn orange at the right. The first quantitative change is “Change Dosage or Time.” This circle overlaps with “Change the Learning Environment To Promote Attention and Engagement,” which in turn overlaps with the first qualitative change, “Combine Cognitive Processing Strategies with Academic Learning.” The final circle is labeled “Modify Delivery of Instruction.”
Further information about each of the four methods of instructional adaptation highlighted above can be found on the subsequent pages. As you view these pages, you might find it helpful to use the advance organizer offered by the National Center on Intensive Intervention.
Intensive Intervention Practice Categories Checklist