How can school personnel identify and select evidence-based practices or programs?
Page 1: Determine School Needs
 As school and district improvement teams across the country strategically prepare for the upcoming school year, they will need to prioritize goals, develop action plans, and allocate funds and resources to help them to realize their vision and to improve outcomes for their students.
Typically, they strive to do this in a systematic way by conducting a needs assessment—a data-driven process for collecting and examining information about school-related issues. Executed correctly, a needs assessment offers an accurate and comprehensive representation of a school’s strengths and weaknesses, and can be used to create a plan for improving student outcomes. School personnel can use the data provided by a needs assessment to identify and prioritize areas for improvement and subsequently to identify evidence-based practices and evidence-based programs that can enhance student outcomes. One way in which school personnel can conduct a needs assessment is summarized below.
evidence-based practice (EBP)
glossary
evidence-based program
glossary
| Step 1: | Assess the school’s needs by gathering information from important stakeholders (e.g., teachers, students, parents, community members) regarding a number of major areas, such as:
|
|||
|

Commonly Used Methods for Collecting Information
| Method | Example | ||||||||||||||||||||||||||||||
| Ranking | Rank the following items from most in need of improvement toleast in need of improvement:
|
||||||||||||||||||||||||||||||
| Rating | Rate how much each area needs improvement::
|
||||||||||||||||||||||||||||||
| Multiple choice | Which of the following areas needs the most improvement?:
|
(Close this panel)
Examples of Needs Assessment Surveys
Outlined below are two methods for collecting information. The first survey—which asks respondents to rate each item—is general enough to be used by teachers, parents, and students. The second survey was specifically designed for teachers and asks them to rank-order a list of items.

|
|
|||
Rank-order the following items from most in need of improvement (1) to least in need of improvement (9):
|
(Close this panel)
| Step 2: | Compile the data and identify the top area or areas of need. School personnel may choose to keep the data for each stakeholder group separate or they may elect to combine the data from all respondents. |
| Step 3: | Examine existing data (e.g., achievement test scores, discipline referrals) related to the top two or three identified needs. These data can confirm the identified need and serve as a baseline for later comparison when evaluating program effectiveness and student outcomes. Schools can examine numerous data sources and look at these data across different time periods (e.g., last year, the last three years) to identify patterns in student performance.
x
baseline glossary |
Data Sources
| Possible Areas of Need | Potential Types of Data | ||||||||||||||
| Student achievement |
|
||||||||||||||
| Curriculum and instruction |
|
||||||||||||||
| School organization |
|
||||||||||||||
| Behavior |
|
||||||||||||||
| School climate |
|
||||||||||||||
| Family and community involvement |
|
||||||||||||||
| Professional development |
|
(Close this panel)
Note: In some cases, school staff may choose to work through the above steps in a different order. For example, school personnel might first examine existing data (Step 3) and then gather data from stakeholders (Step 1).
To learn more about collecting and using data to assess a school’s needs, click on each panelist below.
Expert Panel

Mel Riddile, EdD
National Association of
Secondary School Principals
(NASSP)
(time: 0:58)

Brenda Williams, EdD
Educational Policy,
Planning & Leadership
The College of William and Mary
(time: 3:22)

Transcript: Mel Riddile, EdD
It’s really important for leaders to know the needs of their school before they purchase a practice or program. A major proportion of, like, 70–80 percent of school-change efforts failed. In fact, only 10 percent actually reached their goals. We used to think that activity equaled success, and that if we just did a lot of things it would somehow work out to be more successful, but today leaders have to really be in tune with their school, what the needs of their school are. There has to be a sense of urgency and a clear focus for the staff. So we really need to tie everything right into what the needs of the school are, and it really all starts with data. And that is data on our student performance, operational data, and that’s what really needs to drive it, so we really need to know our school inside and out, and make sure that whatever we do matches the needs of what our school’s needs are. And sometimes packaged programs don’t do that.
Transcript: Brenda Williams, EdD
Generally, there are several ways for school leaders to approach data collection. In this age of accountability, certainly student performance data is very important to identify and determine the educational gaps between groups of students. Of course, the traditional approaches of data collection—such as well-constructed surveys and report card formats—are helpful, but caution should be exercised given the low return-rate on these strategies, and often some incentive is needed to get some of those back. One major recommendation that I would make is that this process should be ongoing rather than once or twice annual snapshots, as we typically engage in when we do a needs-assessment. Leaders should build in environmental-scanning strategies, such as a periodic SWOT analysis to facilitate dialog between the representative groups of teachers and other staff members. SWOT stands for Strengths, Weaknesses, Opportunities, and Threats or challenges. For internal constituents as well as external, the traditional grade- or subject-level representation should not be the only consideration informing such groups. To ensure diverse perspective leaders should include individuals who vary according to their years of experience in the field, gender, ethnicity, teaching styles, and so forth.
With parents and family members, we should consider SES, gender, ethnicity, education levels, grade levels represented, and other factors. We should ask for feedback from honor roll parents as well as the parents of students with academic and behavioral challenges. Family nights with movies for kids and times to dialog for parents is a fairly low-cost strategy for encouraging parents to assist the school with assessing what’s working and what’s not. For community members, strategies such as business roundtables have promise for use with business leaders, particularly at the district level, to gain insight from their vantage point on what schools need to do better and what strengths they see in our graduates that they hire. So, generally, these are some of the strategies that I think work across diverse constituent groups in terms of helping with needs assessment. But it is helpful, once again, that this not be a one-time-only event and that our constituents get use to us asking them these kinds of questions so that they will volunteer or participate in focus groups or other opportunities, which should be multiple things like websites, suggestion boxes, brainstorming sessions. All have promise for giving us the kind of feedback that we are looking toward.
Transcript: Cynthia Alexander, EdD
We do a lot of formal and informal data. We utilize the data that’s provided by the district, but we also do in-house data. We do a SWOT analysis, which is part of the strategic planning process, which is a corporate model but it works in education as well. We take an honest look at the year prior, even the semester prior, and we look at the things that are in place, we look at what’s working, what’s not working, what could be better with more training, and we make decisions based on that. So we look at a very strategic process and be totally honest about the findings and try to build on the strengths, look at our opportunities for growth, and eliminate any weaknesses that will prevent a successful implementation. I do have a very high ELL population, high special ed population, and we did a survey and it amazed me how many students we had whose parents had not graduated from high school. Our approach when it comes to data and information is always given in a non-threatening way. It is never our intention to make the parent feel like they don’t understand. Our goal is to always put it in a way that, no matter how it is interpreted, it’s interpreted in a way where these are the steps that are necessary in order to make sure that your child succeeds. It’s very user-friendly. There’s some parents that we call—you know, the ones who can’t come to the PTA meeting or can’t come to the meetings—we send information home, and it’s at a point where even the child knows some of the major things going on in the school as far as data, and we put it in a digestible form that even the students can explain to the parents what’s going on at the school. And I think when you reach the students, by default you reach the parents. The goal of the school is never to isolate or intimidate the parents with data information. It’s to inform them.
For Your Information
Schools implementing changes to help each student achieve at high levels will find that collaborative leadership is critical. Leadership should be distributed among many staff members, including teachers. These staff members will share responsibilities and will collectively make decisions regarding school improvements.
Click each logo below to learn how Paige Elementary, Grafton Middle, and DuBois High conduct their needs assessment and to view their findings.
 |
 |
 |
Determine School Needs
![]() Paige Elementary School
Paige Elementary School
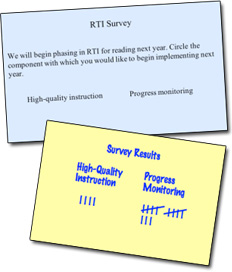
The district is strongly encouraging all schools to adopt an RTI approach for reading. RTI is an approach composed of several components: high-quality instruction, frequent progress monitoring, increasingly intense levels of instruction, and data-based decision making. Paige Elementary’s principal and school improvement team believe that they should begin by implementing either high-quality instruction or frequent progress monitoring and gradually adding the other components. To determine which aspect of RTI to begin implementing this year, they survey the teachers during a staff meeting. The results indicate that the teachers prefer to begin with progress monitoring.
Two pieces of paper: One of them has the header “RTI Survey”, and states, “We will begin phasing in RTI for reading next year. Circle the component with which you would like to begin implementing next year.” The two options listed are “high-quality instruction” and “progress monitoring.” The second piece of paper has the header “Survey Results.” There are four tally marks under “high-quality instruction” and thirteen tally marks under “progress monitoring.”
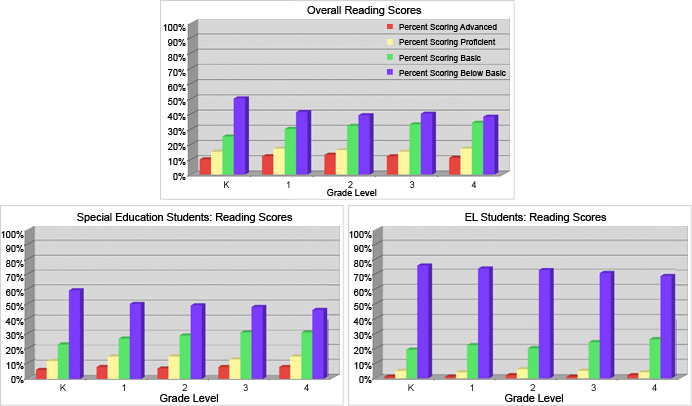
Now that their needs assessment is complete, the school improvement team collects baseline data to use to evaluate program effectiveness and student outcomes after implementation. For this reason, the principal and the rest of the school improvement team examine:
- Standardized test scores for the last year
- Overall scores, reading scores
- Achievement of subgroups (e.g., sped, EL) on this test
- Number of referrals to special education assessment because of poor reading performance
(Close this panel)
Determine School Needs
![]() Grafton Middle School
Grafton Middle School
The school improvement team at Grafton Middle is working to identify areas that need to be addressed during the upcoming school year. As such, they decide to survey teachers and parents to determine their issues of greatest concern. Below are the brief surveys that were passed out to each group. Although the surveys are quite similar, the last item or two on each addresses issues more relevant to a specific target group.
|
|||
Grafton Middle School strives to create a safe and nurturing school environment in which students can experience academic success. To help us to achieve this goal, we want to know how you think we can make Grafton Middle a better school. Please rank-order the following items from most in need of improvement (1) to least in need of improvement (9):
|
|
|||
Grafton Middle School strives to create a safe and nurturing school environment in which your child can experience academic success. To help us with this goal, we want to know how you think we can make Grafton Middle a better school. Please rank-order the following items from most in need of improvement(1) to least in need of improvement (7):
**Please return by next Friday.** |
Once the teachers and parents have returned their surveys, the administrative staff will compile the data by tallying the number of respondents who ranked each item as the area of most concern (see survey results below). The surveys reveal that both teachers and parents identify reading as the area of greatest concern, while both groups rank math as the area of second-most concern.
|
|
Now that the primary areas (i.e., reading and math) have been identified, the school improvement team examines existing sources of data related to those areas of need:
- Standardized test scores for the last two years
- Reading scores, math scores
- Achievement of subgroups (e.g., sped, EL, at-risk)
- Report card grades
The school improvement team examines the standardized test scores for reading and math. The percentage of students that attained low scores during the past two years confirms that these areas, especially reading, do in fact warrant attention.
(Close this panel)
Determine School Needs
![]() DuBois High School
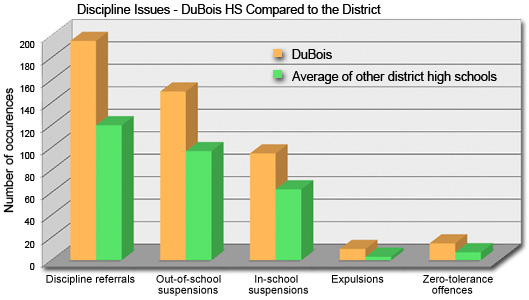
DuBois High School
As they plan for the upcoming year, the school improvement team at DuBois High School creates and distributes the following survey to teachers, parents, and students in order to identify potential areas of school improvement.
|

|
| * | This item was originally worded negatively on the survey. It has been re-stated positively and reverse-coded for use in this results table.The school improvement team notices that the lowest rated items are numbers 5 and 1. They believe that by addressing student discipline and safety (item 5) they will also improve the school climate (item 1).
Now that the primary areas of concern have been identified, the team examines existing sources of data for those areas:
These data indicate that, compared to the rest of the district’s high schools, DHS students show high rates of discipline-related behaviors. These behaviors occur not only in classrooms but also in non-classroom areas (e.g., hallways, the cafeteria). The team decides, therefore, that they need to adopt a schoolwide behavior program. |
(Close this panel)