How can school personnel effectively implement evidence-based practices or programs?
Page 9: Develop a System for Monitoring Fidelity
There’s an old saying, “What gets monitored, gets done.” This seems to hold true when schools implement new practices and programs. Oftentimes, simply by monitoring implementation a school can improve fidelity. As they develop a system for monitoring fidelity, the implementation team needs to:
- Identify methods, measures, and sources
- Establish a data collection plan
- Train data collectors
Research Shows
In the absence of monitoring, teachers tend to alter implementation procedures. Of those teachers who implement preventive programs, 41 percent to 84 percent change components or procedures over time (i.e., they drift) or discontinue their use.
(Tappe, Galer-Unit, & Bailey, 1995)
Identify Methods, Measures, and Sources
School personnel need to identify the methods, measures, and sources they will use to monitor fidelity of implementation. This may mean using evaluation procedures included with a practice or program, if they exist, or it might involve developing their own. In either case, the resulting data will help them to determine whether teachers are adhering to all of a practice or program’s major components.
Methods
 The term method refers to the manner in which data are collected (e.g., through observations, self-report questionnaires, or interviews). Although those coordinating the fidelity data collection might favor self-reports because they are easier to collect, they should keep in mind that teachers often overestimate the degree to which they are following the correct procedures. Research on implementation fidelity has demonstrated that observational data are best for measuring fidelity. However, even observational data has a potential shortcoming, in that many people react to being observed; that is, they may either increase or decrease their level of fidelity relative to those periods when they are not under observation. In the event that this type of reactivity is suspected, steps should be taken to help reduce the person’s reactivity (e.g., frequent observations or videotaping might be used to accustom them to being observed) so as to collect accurate fidelity data.
Measures
 Measures are the forms or products (e.g., lesson plans, student tests) used to collect data. Fidelity measures can often be developed by including each step of the implementation procedures as one or more items on the form. Two categories of items should be included on these measures. The first addresses the quantity of implementation—the number of procedural steps to which teachers adhere. The second addresses the quality of implementation—how well the teacher implements the instructional procedures.
If school staff create their own fidelity measures, they need to ensure that these measures are both reliable and valid. A reliable measure will yield the same results even if the same behavior is measured at either two different times by the same person or at the same time by two different observers. A valid measure is one that measures what it is intended to measure. Click the links below to learn more about:
The purpose of establishing the reliability of a measure is to ensure that if two people use a given measure to observe the same activity they will get the same results. To establish the reliability of fidelity measures, school personnel should compare the agreement between observers who are evaluating the same activities at a given time. High agreement between observers indicates a reliable measure. In the example below, Observers 1 and 2 agreed on three items (i.e., items 2, 3, and 4). They disagreed about whether item 1 occurred during the observation. Their rate of agreement is 75 percent, a relatively high degree, suggesting that the measure they were using was fairly reliable.
|
|
|||||||||||||||||||||||||
The purpose of establishing the validity of a measure is to ensure that it is assessing the activities or components that it is intended to evaluate. There are two types of validity that should be considered: convergent and divergent.
Convergent validity
Convergent validity is the degree to which two measures agree. To establish the convergent validity of fidelity measures, school personnel should compare two types of data collection measures (e.g., observation and teacher self-report questionnaire). Ideally, the validity of one of the measures should already be established. If responses to the second measure agree with those of the first, this indicates that the second measure is evaluating the same activities or construct as the first, and is therefore valid. The example below illustrates two measures that demonstrate convergent validity.
|
|
|||||||||||||||||||||
Divergent validity
Even if school personnel establish the convergent validity of a measure, it is a good idea to also establish the divergent validity of the measure. Divergent validity is the degree to which the results of a measure do not agree with the results of a measure of a similar but distinct construct (e.g., a measure of the implementation of a second-grade reading program does a poor job assessing fifth-grade reading instruction). To establish divergent validity, school personnel need to administer the fidelity measure in both a second-grade class implementing the new program and a fifth-grade reading class not implementing that program. The example below illustrates a measure that demonstrates divergent validity.
|
|
|||||||||||||||||||||
Fidelity for the second-grade class is 100 percent; the teacher engaged in all the listed activities. Fidelity for the fifth-grade class is 0 percent; the teacher did not engage in any of the listed activities (as would be expected for a fifth-grade reading program). This indicates divergent validity. The measure is a valid one for the implementation of the second-grade reading program.
Click the movie below to learn how the step-by-procedures from the POW writing strategy were used to create a fidelity measure (time: 1:29).
Transcript: Creating a Fidelity Measure
Now that they have developed a task analysis for the POW writing strategy, the implementation team is ready to create a fidelity measure. They begin by selecting their methods of data collection as well as the individuals who will supply that data. They choose to collect observational data and teacher self-reports of fidelity. Beginning with the observational measure, the team examines the items on the task analysis.
Although these items seem to include all of the essential steps and are a good start for an observational measure of fidelity, the team would like to add some items on quality to address how well each teacher is implementing the steps. They review their materials on SRSD for ideas about how to assess the quality of implementation of the POW writing strategy. Using this information, they add several items related to the quality of implementation.
The team then decides that a three-point scale is sufficient to rate fidelity.
These new items are then incorporated into the existing observation checklist.
The team members also want to create a teacher self-report checklist.
They find that with a little re-writing, the observation checklist is easily transformed into a self-report checklist.
Activity
Now that Truman Elementary School personnel have identified the PALS 2–6 procedures, the implementation team needs to create a fidelity measure. They want to begin by creating an observation form.
General Procedures
- Introduce PALS session
- Have students transition to pairs quickly and quietly
- Have system in place for students to quickly and easily access materials
Specific Procedures
- Implement Partner Reading with Retell for 12 minutes
- Follow script
- Have students switch partners after 5 minutes
- Instruct lower performing reader to retell story for 2 minutes
- Monitor students
- Implement Paragraph Shrinking for 10 minutes
- Follow script
- Have students switch partners after 5 minutes
- Monitor students
- Implement Prediction Relay for 10 minutes
- Follow script
- Have students switch partners after 5 minutes
- Monitor students
- Have students put away materials in 2 minutes or less
Using this information, help the team create an observation form. Hint: Be sure to include items that relate to quantity and quality of implementation.
|
PALS 2–6 Observation Form Date: ________________ Teacher: ____________________ Observer: _______ Introduction (2 minutes or less) ___ 1. Introduce PALS session ___ 2. Instruct students to transition to pairs quickly and quietly ___ 3. Have system in place for students to quickly and easily access materials Partner Reading ___ 4. Implement for 10 minutes ___ 5. Follow script ___ 6. Instruct students to switch partners after 5 minutes ___ 7. Monitor students Retell ___ 8. Implement for 2 minutes ___ 9. Follow script ___ 10. Monitor students Paragraph Shrinking ___ 11. Implement for 10 minutes ___ 12. Follow script ___ 13. Instruct students to switch partners after 5 minutes ___ 14. Monitor students Prediction Relay ___ 15. Implement for 10 minutes ___ 16. Follow script ___ 17. Instruct students to switch partners after 5 minutes ___ 18. Monitor students Wrap Up (2 minutes or less) ___ 19. Have students put away materials Quality Items 20. How well did the teacher implement the PALS instructional activities? ___ 1. Not well ___ 2. Average ___ 3. Very well 21. How well did the teacher monitor the students? ___ 1. Not well ___ 2. Average ___ 3. Very well |
Sources
 The term sources refers to the individuals––such as teachers, observers, and PD coaches––who provide information or data about fidelity of implementation. In general objective observers are more accurate sources of fidelity data than teachers who complete self-report forms. However, teachers can learn to more accurately gauge their fidelity when they have the opportunity to compare their responses on a self-report of fidelity to an objective observer’s responses for the same time period. This may also help observers or coaches to identify areas that require additional training or support.
| Methods/ Measure | Sources | ||
|---|---|---|---|
| Teacher | Fellow Teacher |
PD Coach |
|
|
✔ | ||
|
✔ | ||
|
✔ | ||
|
✔ | ||
Listen as Daryl Mellard explains the benefits and drawbacks of several types of commonly used methods and measures for assessing fidelity of implementation (time: 1:52).
Daryl Mellard, PhD
Co-Principal Investigator,
National Center on Response to Intervention

Transcript: Daryl Mellard, PhD
Measurement of fidelity use a number of different tools. Some of those can be as simple as looking at a teacher’s log, or a teacher’s lesson plan, and seeing that the curriculum at least was intended to be delivered for a specific time period with a particular frequency over so many weeks. Generally, we like to have observations made within the classroom, and in that way we can look more carefully at adherence and the teacher’s delivery. We get a better sense of a student engagement and ensure that there wasn’t drift. Another way is to look at student products. You might expect that if students demonstrated the knowledge or skills that there was high fidelity. But, on the other hand, you don’t know whether the student was demonstrating skills that he or she had acquired in another environment, so that’s one of the downfalls of just using student products, why we like to have more direct observations. Surveys would be generally, again, not as accurate as having that third person in the room making observations or using videotape and reviewing the videotape of the lessons. If we just rely on a self-report or surveys, we don’t have as clear a lesson of how the fidelity was maintained. I think you can use it as a complement to observations and might be a good basis for discussion with someone making the observations, but I wouldn’t want to rely on those surveys.
Establish a Data Collection Plan
Once the methods, measures, and sources of implementation fidelity data have been identified, the implementation coordinator or team needs to create a plan to collect that data. These collection procedures should be systematic and consistent, and they should be conducted with an emphasis on problem solving and self-improvement, and should avoid being evaluative or punitive. Click on each item below to learn more about several types of information that the plan can include:
A number of school personnel can collect fidelity data, as long as they are properly trained. For instance:
- A coordinator can collect and analyze self-report forms.
- Teachers can observe one another, schedules permitting.
- Teachers, administrators, or other trained personnel can conduct interviews.
Research indicates that fidelity data should be collected frequently at first (e.g., twice per week) but that it then can be collected less often (e.g., once per month) as personnel become more familiar with the practice or program and maintain high levels of fidelity. Periodic, unannounced spot checks have been shown to be quite effective for maintaining high fidelity levels.
There are several potential sources for identifying fidelity criteria for a given practice or program. For instance:
- The administration manual for a packaged practice or program may indicate the acceptable level of fidelity.
- The original validating research may specify the level of fidelity that yields positive student outcomes.
If specific information about the fidelity criteria for a practice or program is unavailable, a general rule of thumb is to aim for 85 percent fidelity (i.e., percent of the program tasks that were implemented correctly).
There should be a decision-making system in place to help the implementation team decide what actions will be required following a finding of low fidelity. For example, it may be sufficient to offer feedback and conduct further observations soon afterward (e.g., a week later), or it may be necessary for the staff person demonstrating low fidelity to participate in other activities, such as a booster session or mentoring.
Train Data Collectors
Once they have identified their data collectors, the school implementation team can schedule training. As with PD training, the training of data collectors should consist of a combination of discussion of theory, the modeling of skills, and the practice and refinement of skills. Before they can begin collecting fidelity data, data collectors have to prove themselves to be reliable. This means that their scoring of surveys and ratings must agree strongly with the scoring and ratings of an expert data collector and with each other. Ideally, periodic inter-observer reliability.
inter-observer reliability
glossary
 |
 |
 |
Develop a System for Monitoring Fidelity
![]() Paige Elementary School
Paige Elementary School
To assess the fidelity of implementation of progress monitoring in the reading classes, the implementation team determines that they will observe teachers and monitor the computerized student data. The first method of assessment will consist of the members of the team observing all reading teachers on a regular basis—once per week until the teachers have achieved fidelity (i.e., 85 percent adherence) and once every two weeks thereafter. The members of the implementation team will observe each other. All members of the implementation team will attend training provided by the district RTI coordinator on how to collect data using the district fidelity checklist (see the Classroom Observation Form below). This measure has been validated and proven to be reliable.
|
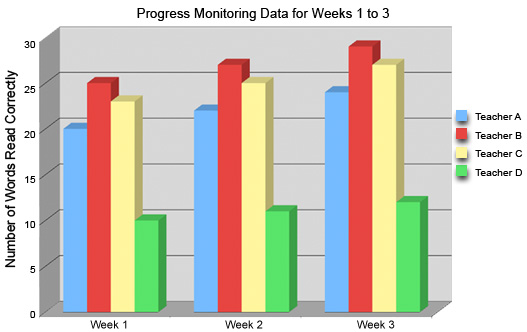
The implementation team will also monitor fidelity by examining the computerized student progress monitoring data. Data can be compared across classrooms. The implementation team will look for patterns or major differences in student performance across teachers. An abnormal pattern will be investigated to ensure that the teacher is adhering to the progress monitoring procedures. The graph below depicts the average progress monitoring scores for four classrooms. The students in Teacher D’s class consistently score much lower than their peers on this measure. This pattern warrants some further investigation to determine whether Teacher D is implementing progress monitoring with fidelity.
(Close this panel)
Develop a System for Monitoring Fidelity
![]() Grafton Middle School
Grafton Middle School
As the implementation team looks over the program materials, they discover that the reading program includes an administration manual but not fidelity measures. They decide to develop some measures to monitor implementation fidelity of the reading program.
Having reviewed the general instructions, they list the following step-by-step procedures:
|
|||
|
Reading program procedures
|
The Grafton Middle implementation team used this list of procedures to create two forms (see below): an observation measure (i.e., Fidelity of Implementation Checklist) and a teacher self-report form (i.e., Teacher Self-Report Checklist). The step-by-step procedures were translated into items on these measures. Whereas most of the questions address the quantity of implementation, items 6, 7, and 8 assess the quality of implementation.
The first form should be completed by a trained observer. In addition to observing the teacher while she is conducting the reading lesson, the observer will need to:
- Know the daily scheduled time of the lesson
- Have on hand a copy of the script for that day’s lesson
Fidelity of Implementation ChecklistDate: ________________ Teacher: ____________________ Observer: _______ |
||||||||||||||
| Instructions: Put a checkmark in the column labeled Yes or No depending on whether the teacher completed the task. | ||||||||||||||
| Yes | No | |||||||||||||
|
||||||||||||||
|
||||||||||||||
|
||||||||||||||
|
||||||||||||||
|
||||||||||||||
|
||||||||||||||
|
||||||||||||||
|
||||||||||||||
|
||||||||||||||
|
||||||||||||||
|
||||||||||||||
|
||||||||||||||
|
||||||||||||||
|
||||||||||||||
|
||||||||||||||
The second form (below) assesses the same activities as the first form, but will be completed by a teacher implementing the reading program.
Teacher Self-Report ChecklistTeacher: ____________________ Date: ________________ |
||||||||||||||
| Instructions: Put a checkmark in the column labeled Yes or No depending on whether you completed the task. | ||||||||||||||
| Yes | No | |||||||||||||
|
||||||||||||||
|
||||||||||||||
|
||||||||||||||
|
||||||||||||||
|
||||||||||||||
|
||||||||||||||
|
||||||||||||||
|
||||||||||||||
|
||||||||||||||
|
||||||||||||||
|
||||||||||||||
|
||||||||||||||
|
||||||||||||||
|
||||||||||||||
|
||||||||||||||
Now that they have created fidelity measures, the team validates them and establishes reliability. They then train their observers and establish inter-rater reliability.
Next, the team decides on the parameters of the fidelity data collection. At the beginning of implementation, three observations and three teacher checklists will be collected on each teacher within a two-week period. If fidelity is high, fidelity data (i.e., observation and teacher checklist) will be collected monthly for the remainder of the school year. The team also establishes 85 percent adherence as the criteria for fidelity. If fidelity is low, one of the coaches will work with that teacher until he or she can implement the program with fidelity. Once the teacher demonstrates high fidelity, he or she will be monitored monthly just like the rest of the teachers. In the event that time becomes an issue, videotaped lessons will be used to check fidelity.
(Close this panel)
Develop a System for Monitoring Fidelity
![]() DuBois High School
DuBois High School
To monitor the fidelity of implementation, the DuBois PBIS implementation team uses an assessment tool provided by the PBIS Center. The information necessary for this assessment tool is gathered from multiple sources that include a review of permanent products, observations, and a minimum of ten staff and fifteen student interviews or surveys. These data are collected before schoolwide PBIS begins, 6–12 weeks after PBIS is implemented, and at the end of the school year. A portion of this fidelity data collection form (i.e., Schoolwide Evaluation Tool, or SET) is shown below. This form is typically completed by an objective observer at the district level who gathers data from several different sources (e.g., interviews, observations, permanent products).
| Feature | Evaluation Question | Data Source (circle sources used) P = product; I = interview; O = observation | Score: 0–2 | ||
|---|---|---|---|---|---|
| A. Expectations Defined | 1. Is there documentation that staff has agreed to 5 or fewer positively stated school rules/ behavioral expectations? (0 = no; 1 = too many/ negatively focused; 2 = yes) |
|
|||
| 2. Are the agreed upon rules & expectations publicly posted in 8 of 10 locations? (See interview & observation form for selection of locations). (0 = 0–4; 1 = 5–7; 2= 8–10) |
|
||||
| B. Behavioral Expectations Taught | 1. Is there a documented system for teaching behavioral expectations to students on an annual basis? (0 = no; 1 = states that teaching will occur; 2 = yes) |
|
|||
| 2. Do 90% of the staff asked state that teaching of behavioral expectations to students has occurred this year? (0 = 0–50%; 1 = 51–89%; 2 = 90%–100%) |
|
||||
| 3. Do 90% of team members asked state that the schoolwide program has been taught/reviewed with staff on an annual basis? (0 = 0–50%; 1 = 51–89%; 2 = 90%–100%) |
|
||||
| 4. Can at least 70% of 15 or more students state 67% of the school rules? (0 = 0–50%; 1 = 51–69%; 2 = 70–100%) |
|
||||
| 5. Can 90% or more of the staff asked list 67% of the school rules? (0 = 0–50%; 1 = 51–89%; 2 = 90%–100%) |
|
||||
| C. On-going System for Rewarding Behavioral Expectations | 1. Is there a documented system for rewarding student behavior? (0 = no; 1 = states to acknowledge, but not how; 2 = yes) |
|
|||
| 2. Do 50% or more students asked indicate they have received a reward (other than verbal praise) for expected behaviors over the past two months? (0 = 0–25%; 1 = 26–49%; 2 = 50–100%) |
|
||||
| 3. Do 90% of staff asked indicate they have delivered a reward (other than verbal praise) to students for expected behavior over the past two months? (0 = 0–50%; 1 = 51–89%; 2 = 90–100%) |
|
(From the Positive Behavioral Interventions & Support website, http://www.pbis.org/pbis_resource_detail_page.aspx?Type=4&PBIS_ResourceID=222)
(Close this panel)