How can teachers determine whether students are making appropriate progress?
Page 7: Make Data-Based Instructional Decisions
 Once a student’s data have been plotted on the graph, the educator can determine whether the student is on target to reach the identified goal within the established timeframe. To confidently obtain a clear picture of the student’s performance, the educator should graph at least six to eight data points. Too few data points can lead to an inaccurate interpretation, whereas gathering too many data points may result in a failure to address a student’s needs in a timely manner. On any given day, a student’s performance might or might not be an accurate reflection of her knowledge and skills due to circumstances as common as illness or fatigue. A greater number of data points will help to reduce errors in decision making. Additionally, because GOM monitors student progress throughout a long-term instructional program, instruction must be in place long enough for educators to determine that the instructional procedures are effective. Implementing at least three weeks of instruction allows an educator to decide whether the instruction is effective and the student is on track to meet the long-term goal.
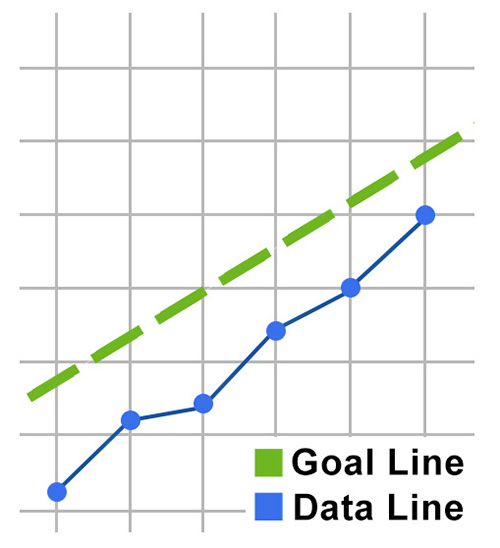
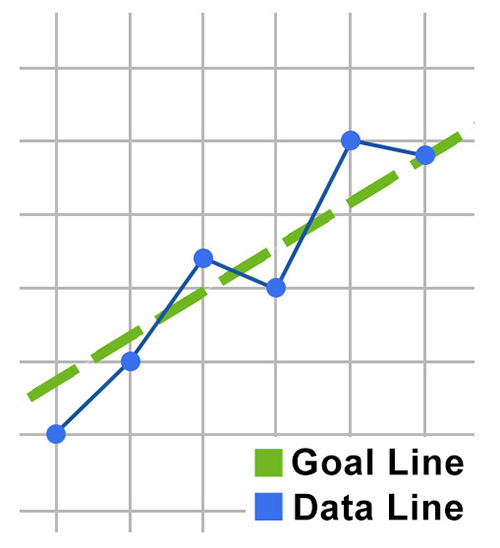
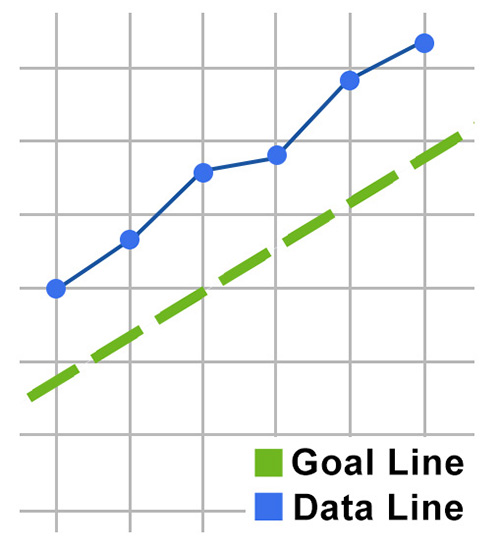
To gain a clear understanding of how a student is performing, an educator should collect between six and eight data points. For many students, six data points (such as in the graph on the left) will allow the educator to make an informed instructional decision. For other students, the educator might need to collect slightly more data (such as in the graph on the right) to make an informed instructional decision.
After collecting enough data points, the educator is ready to evaluate a student’s performance and determine whether the student is on track to meet an established long- or short-term goal. For an educator who progress monitors once per week, this equates to reviewing data and making instructional decisions approximately every six weeks. For an educator who progress monitors twice per week, this equates to reviewing data and making instructional decisions approximately every three weeks. Regular ongoing evaluation will allow the educator to assess the effectiveness of instruction for individual students, or perhaps the entire class, and make any needed changes to instruction in a timely manner. Following are two methods that educators can use to evaluate student performance and make data-based instructional decisions.
Four-Point Method
When using the Four-Point Method, the educator examines the relationship between the four most recent data points and the goal line on the student’s graph. Determining whether the data points are above, below, or around the goal line allows the educator to make a data-based instructional decision, sometimes referred to as data-driven instruction (DDI). The table below illustrates how to use this method to interpret student data and to determine the corresponding instructional response.
| Position of the Four Most Recent Data Points | Instructional Response |
|---|---|
|
Above the goal line…
|
Increase the goal — If the student’s four most recent data points are above the goal line, the student’s performance is exceeding expectations and a slightly more ambitious goal is needed. |
|
Below the goal line…
|
Revise instruction — If the student’s four most recent data points are below the goal line, the student is not making adequate progress. In this case, the educator should try a different instructional approach and continue to collect data to see whether the instructional change helps the student make progress. |
|
Split the goal line…
|
Keep collecting data — If the student’s four most recent data points are split (there are neither four consecutive points above nor below the goal line), the educator should keep collecting data until it is possible to apply a decision-making rule. No changes to instruction are necessary at this time. |
Activity
Ms. Chee is ready to evaluate her students’ performance and make instructional decisions based on their CBM graphs. She will begin with Madison and José.

Madison

José
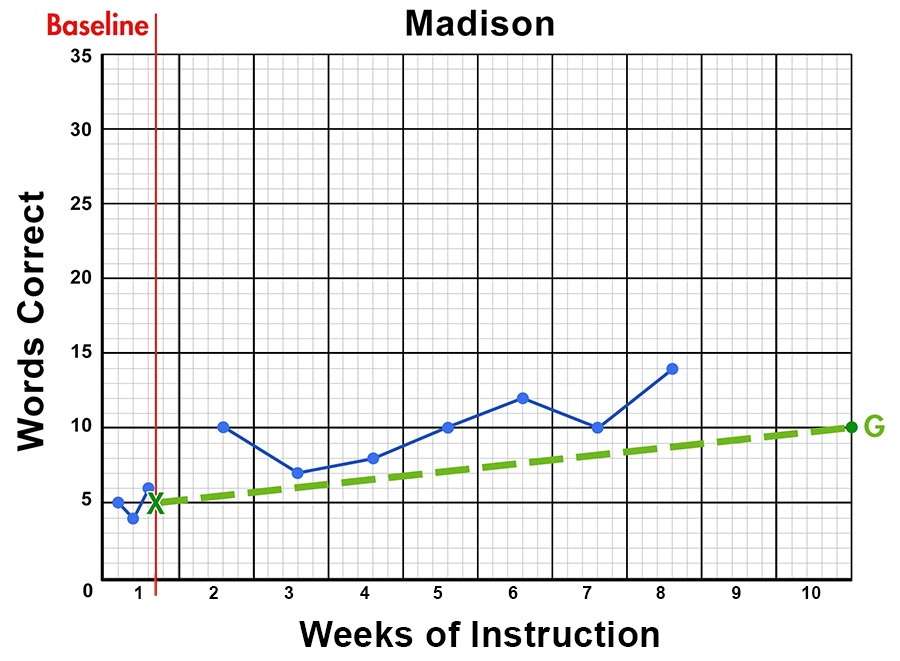
Using Madison’s CBM graph above, evaluate her performance using the Four-Point Method:
- Her last four data points are:
FEEDBACK 1 - Which instructional decision should Ms. Chee make?
FEEDBACK 2
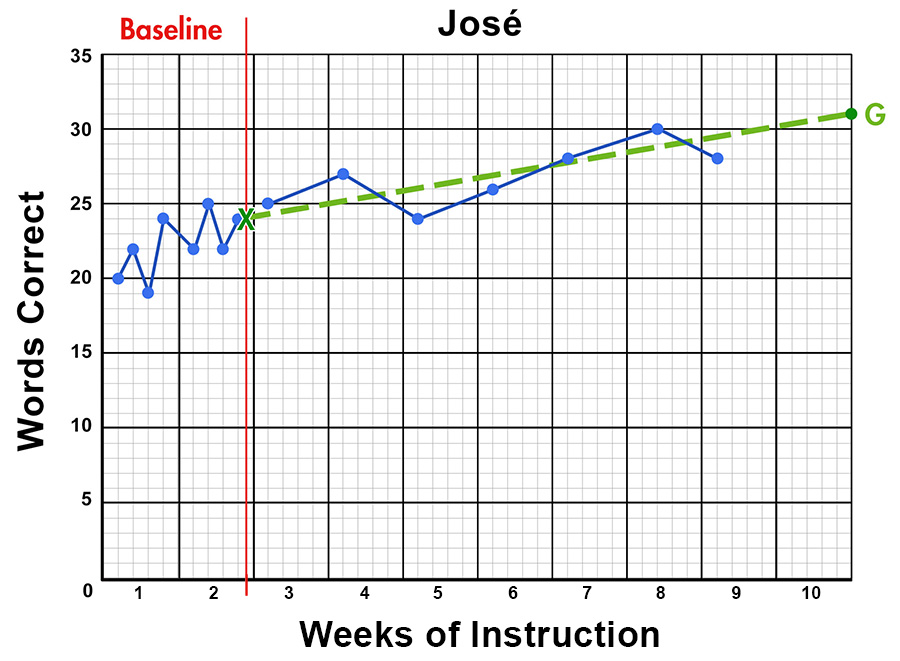
Using José’s CBM graph above, evaluate his performance using the Four-Point Method:
- His last four data points are:
FEEDBACK 3 - Which instructional decision should Ms. Chee make?
FEEDBACK 4
Although the Four-Point Method enables quicker decision-making, educators should neither rely on it exclusively nor should they use it indefinitely. If after collecting eight data points a student does not have a pattern of four consecutive scores above or below the goal line, the educator should use a trend line analysis to make a data-based instructional decision.
Trend Line Analysis
When using a trend line analysis, educators compare the student’s goal line and trend line—the straight line representing the general direction of the graphed scores. Although many software programs will graph a trend line, educators can use the Tukey method to graph a trend line by finding the line of best fit for a student’s data across a given period. The video below illustrates step-by-step instructions for accurately and efficiently drawing a trend line as well as for comparing the trend line and goal line to evaluate the student’s performance.
Evaluating Student Performance Using a Trend Line Analysis: The Tukey Method
Educators can use trend line analysis to evaluate student performance and make data-based instructional decisions. When using this method, the educator compares the student’s goal line and trend line. The goal line is the straight dotted line representing a student’s expected rate of improvement needed to meet a predetermined goal. It may be denoted by a capital G. The trend line is the straight solid line representing the general direction of the student’s scores. It may be denoted by a capital T.
Before conducting a trend line analysis, the educator should collect at least eight data points. For example, educators can collect data once per week across eight weeks of instruction or twice per week across four weeks of instruction. Once these data are collected, the educator can easily and quickly create a trend line using the Tukey method. Let’s look at an example.
An educator collected data once per week for eight weeks and graphed the following scores: 9, 12, 14, 11, 15, 14, 12, and 15. The educator then used the following steps to create a trend line.
Step 1: Divide scores into three relatively equal groups. If the scores cannot be divided equally, divide them into approximate thirds. In our example we have eight scores, so we divided them into approximate thirds. We do this by drawing two vertical lines—denoted in pink—that place three scores in the first group, two in the second group, and three in the third group.
Step 2: Find the intersection of the midrate and middate for the first group of scores. The midrate or median score is the score that falls in the middle when scores are arranged from lowest to highest. The middate is the middle week of instruction. Place an X at the intersection of the midrate and middate. In our example, the first group contains three scores across the first three weeks of instruction. The scores are already arranged from lowest to highest, so we can easily identify the midrate and the middate. Now we place an X at the intersection of the midrate (12) and the middate (Week 2).
Step 3: Find the intersection of the midrate and middate for the third group of scores. In our example, the third group consists of three scores across the final three weeks of instruction. Once we arrange these scores from lowest to highest, we can easily identify the midrate and middate. Now we place an X at the intersection of the midrate (14) and the middate (Week 7).
Step 4: Draw the trend line. Draw a line beginning at the X in the first group and continuing through the X in the third group. In our example, we draw a line from the first point to the second point to create the trend line. We then label it with a capital T.
After using the Tukey method to graph a trend line, you can use a trend line analysis to evaluate student performance. If the trend line is steeper than the goal line, the student’s performance is exceeding expectation and a more ambitious goal is needed. If the trend line is flatter than the goal line, the student is not making adequate progress. As such, the educator should implement a different instructional approach and monitor the student’s progress to determine if the approach is effective. Finally, if the trend line is around the goal line, the student is on target to meet the goal. No changes to instruction are necessary at this time, and the educator should continue collecting data.
Looking back at our example, we see that the student’s trend line is flatter than the goal line. The educator will implement a different instructional approach and monitor the student’s progress to determine if this approach is effective.
For a detailed description of this process and how to use a trend line analysis to interpret student data and to make an instructional decision, view the following IRIS Information Brief:
Evaluating Student Performance Using a Trend Line Analysis: The Tukey Method
Activity
 Ms. Chee administers oral reading fluency measures to Sidney each week. Use the Tukey method to graph Sidney’s trend line and to evaluate her performance
Note: To review step-by-step instructions, refer to the above tutorial video and IRIS Information Brief.
|
Group 1 Group 2 Group 3 |
|
Midrate Middate Week |
|
Midrate Middate Week |
Using Sidney’s graph above, evaluate her performance using a trend line analysis.
- Sidney’s trend line is:
FEEDBACK 5 - Which instructional decision should Ms. Chee make?
FEEDBACK 6
For Your Information
When data indicate that a student is not making progress, the educator should revise the instructional approach or try a different one. The most effective way to teach reading is to implement evidence-based practices (EBPs)—practices and strategies that have been shown to be effective through rigorous research. The following Centers offer resources for addressing the needs of these learners.
High-Leverage Practices
High-leverage practices (HLPs) are fundamental or foundational practices for general and special educators that are critical for student learning and improved outcomes. This module aligns with the following HLPs.
![]() General Education—HLP17: Interpreting the results of student work, including routine assignments, quizzes, tests, projects, and standardized assessments. Learn more at TeachingWorks.
General Education—HLP17: Interpreting the results of student work, including routine assignments, quizzes, tests, projects, and standardized assessments. Learn more at TeachingWorks.
![]() Special Education—HLP6: Use student assessment data, analyze instructional practices, and make necessary adjustments that improve student student outcomes. HLPs for special educators were developed by CEEDAR and the Council for Exceptional Children (CEC). Learn more at High-Leverage Practices for Students with Disabilities.
Special Education—HLP6: Use student assessment data, analyze instructional practices, and make necessary adjustments that improve student student outcomes. HLPs for special educators were developed by CEEDAR and the Council for Exceptional Children (CEC). Learn more at High-Leverage Practices for Students with Disabilities.
Graph Reflecting Instructional Change
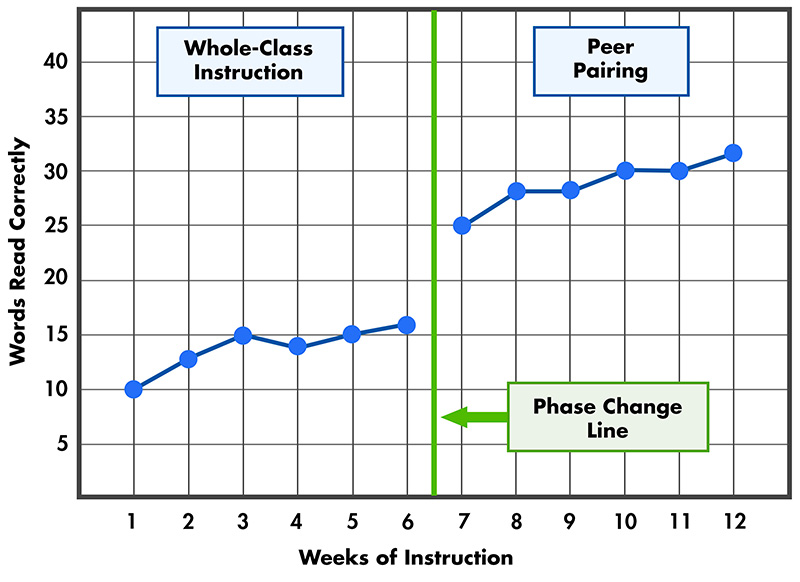 Recall that GOM data can help the educator identify individual students who may need a change of instruction or additional instructional support. To indicate when a change of instruction occurs (e.g., adding small-group instruction, changing instructional strategies, implementing an intervention), the educator should draw a solid vertical line on the graph—sometimes referred to as a phase change line. This solid line allows school personnel to compare progress made before and after the change to instruction. Moving forward, the educator should continue to administer the same probes and use the same scoring procedures to determine whether the change in instruction resulted in improved performance.
For Your Information
If a student’s goal changes, the educator should draw a dotted vertical line—also referred to as a phase change line. Similarly, this dotted vertical line allows school personnel to compare progress made before and after the change in goal.