RTI (Part 2): Assessment
Assessment
Take some time now to answer the following questions. Please note that the IRIS Center does not collect your Assessment responses. If this is a course assignment, you should turn them in to your professor using whatever method he or she requires. If you have trouble answering any of the questions, go back and review the Perspectives & Resources pages in this module.
- What are the four components of RTI?
- The two types of assessment used in RTI are universal screening and progress monitoring. Describe the purpose of each of these two types of assessment.
For the next two questions, imagine that you are Ms. Hayes, a first-grade teacher at Rosa Parks who is also piloting the RTI approach.

- You are concerned about how you will complete the universal screening measure with all of your students and about how you will incorporate progress monitoring into your weekly lesson plan. To prepare for this task, complete the table below.
Note: Some of the items (marked by *) have been selected by the S-Team and cannot be changed. For these items, use the information that was provided in the module. Complete the remaining items with information that will best work with your schedule.
| Assessment | Questions to Consider for Planning | Ms. Hayes’s Plan |
| Universal Screening | How often will the universal screening be administered (frequency)? When? | * |
| What universal screening measure is my school using? | * | |
| What is the selection criterion? | * | |
| What day (week/ month) will I begin the administration of the universal screening measure? | Note: must be completed by the end of September | |
| When during the day will I schedule the screening? | ||
| How much time will I set aside each day for the screening? | ||
| Progress Monitoring | What progress monitoring measure(s) is my school using? | * |
| How often will I administer progress monitoring probes? | * | |
| On which students will I collect progress monitoring data? | ||
| When will I schedule the administration of probes (days/ time)? | ||
| What is the criterion set by the school to warrant Tier 2 placement? | * | |
| Who will graph the data? |
- In September, you administer the beginning-of-year universal screening using a Dolch sight word list. Below is a list of the students’ scores. (Remember that Rosa Parks identifies the students scoring in the bottom 25 percent as struggling readers.)
- What steps would you take to determine which students are in the bottom 25 percent of the class?
- List the names of the struggling students and describe what will happen to them during Tier 1 instruction.
- Imagine that the criterion for identifying struggling readers is a score below 15. How would this new criterion affect the number of students being identified as struggling readers?
Sasha 30 Keisha 23 Bobby 12 Peyton 6 Dylan 17 Rachel 11 Sam 18 Kaitlyn 13 Maverick 9 Kamini 19 Carson 7 Kayleigh 16 Christopher 14 Andrew 20 Porter 10 Abby 10 Holly 15 Shantaya 14
- Below are the graphs for three students. Review each graph and make a tier decision for each student. The benchmark and slope criteria are those used for the WIF (i.e., slope ≥ 1.8; fall benchmark = 15; winter benchmark = 25; spring benchmark = 30). Remember to use the slope calculator located on Perspectives and Resources Page 5.
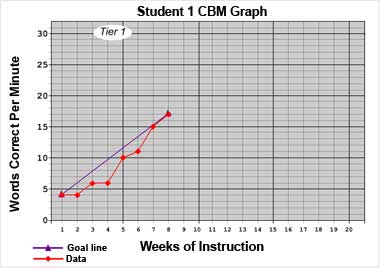
This CBM graph for Tier 1 has a Y or vertical axis labeled “Words Correct Per Minute” that is divided into six, five-point increments from 0 to 30. Its X or horizontal axis is labeled “Weeks of Instruction” and is divided into twenty, one-week increments, 1–20. In this example, the data are presented as two lines. The purple goal line is a diagonal upward slope beginning at four words per minute in week one and terminating at seventeen words per minute in week eight. The student data is a red line running roughly parallel to the goal line. It shows that the student read four words correctly in weeks one and two, six correctly in weeks three and four, ten correctly in week five, eleven in week six, fifteen in week seven, and seventeen in week eight.
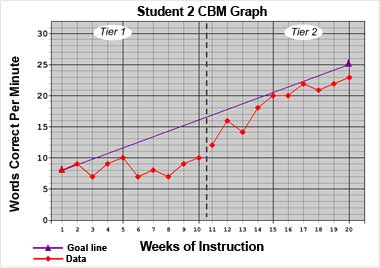
This CBM graph for Tiers 1 and 2 has a Y or vertical axis labeled “Words Correct Per Minute” that is divided into six, five-point increments from 0 to 30. Its X or horizontal axis is labeled “Weeks of Instruction” and is divided into twenty, one-week increments, 1–20. The graph is divided between weeks ten and eleven with a dotted line to denote the shift from Tier 1 to Tier 2 instruction. In this example, the data are presented as three lines, a goal line, Tier 1 data, and Tier 2 data. The purple goal line is a diagonal upward slope beginning at eight words per minute in week one and terminating at twenty-three words per minute in week twenty. The student data for Tier 1 show that the student read the following number of words correctly per minute in each of the ten weeks: 8, 9, 7, 9, 10, 7, 8, 7, 9, and 10. The line running through the data highlights that the student’s data somewhat followed the goal line for the first four weeks but fell sharply below the goal line in weeks six through ten. The student data for Tier 2 show that the student read the following number of words correctly per minute in the subsequent ten weeks: 12, 16, 14, 18, 20, 20, 22, 21, 22, and 23. The line running through the data highlights that the student’s data was parallel to the goal line, although slightly below it.
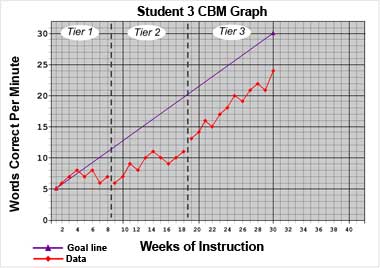
This CBM graph for Tiers 1, 2, and 3 has a Y or vertical axis labeled “Words Correct Per Minute” that is divided into six, five-point increments from 0 to 30. Its X or horizontal axis is labeled “Weeks of Instruction” and is divided into thirty, one-week increments, 1–30. The graph is divided between weeks eight and nine with a dotted line to denote the shift from Tier 1 to Tier 2 instruction. A second dotted line between weeks eighteen and nineteen show the transition from Tier 2 to Tier 3. In this example, the data are presented as three lines, a goal line, Tier 1 data, and Tier 2 data. The purple goal line is a diagonal upward slope beginning at five words per minute in week one and terminating at twenty-four words per minute in week thirty. The student data for Tier 1 show that the student read the following number of words correctly per minute in each of the eight weeks: 5, 6, 7, 8, 7, 8, 6, and 7. The line running through the data highlights that the student’s data followed the goal line for the first four weeks but fell below the goal line in weeks five through eight. The student data for Tier 2 show that the student read the following number of words correctly per minute in weeks nine through eighteen: 6, 7, 9, 8, 10, 11, 10, 9, 10, and 11. The line running through the data highlights that the student’s data was parallel to the goal line, although below it. The student data for Tier 3 show that the student read the following number of words correctly per minute in weeks nineteen through thirty: 13, 14, 16, 15, 17, 18, 20, 19, 21, 22, 21, and 24. The line running through the data highlights that the student’s data was parallel to the goal line, although below it.
To learn more about research-based reading strategies that may be used with RTI to improve reading skills, proceed to the following IRIS Module: