How will teachers determine which students need more intensive instruction?
Page 7: Tier 2 Components
Students who require Tier 2 intervention are those who did not respond adequately to the high-quality instruction provided in the general education classroom (i.e., Tier 1). This tier of RTI usually involves more intensive targeted intervention and frequent monitoring.
Targeted Intervention
 Targeted intervention involves providing a standard, validated instructional program to students in a group typically consisting of no more than five students. This intervention should be provided by someone who has received extensive training in the intervention program and may be implemented by general education teachers, paraprofessionals, reading specialists, or other qualified individuals. No matter who delivers Tier 2 intervention, the general education teacher should share responsibility for the instructional planning and the decision-making process for these students.
For more information on Tier 2 reading instruction, view the IRIS Module:
Frequent Monitoring
The individual providing Tier 2 instruction needs to continue to monitor student progress. The procedures and measures used for progress monitoring in Tier 2 are the same as those used in Tier 1. This phase of intervention should be provided for a minimum of 10 weeks, during which it is recommended that the Tier 2 instructor continue to plot each student’s scores on his or her existing progress monitoring graph. The instructor should draw a dotted vertical line to indicate when Tier 2 intervention begins. This will allow school personnel to compare the progress made during the different tiers of intervention. Click here to see an example of a graph containing both Tier 1 and Tier 2 interventions.
LaToya’s CBM Graph
Example of a graph that contains both Tier 1 and Tier 2 intervention
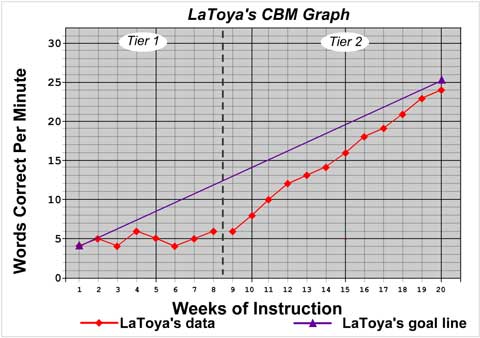
This graph shows LaToya’s Tier 1 and Tier 2 data. The dotted vertical line indicates when Tier 2 intervention begins. It is common practice to draw a dotted vertical line on a graph to indicate the point at which instruction or intervention changes.
RTI Tier Decision Process
In addition to the two methods of evaluating student progress discussed in the Tier 1 section (i.e., performance level, rate of growth), a third method can be used to evaluate student progress. This method consists of using performance level and rate of growth in conjunction and is the preferred means for determining whether students are responding adequately to Tier 2 intervention. Research demonstrates that using both criteria provides a better picture of how students are responding to Tier 2 intervention than does either criterion alone.
dual discrepancy approach
glossary
Research Shows
- The use of both criteria, performance level and rate of growth, was shown to be the most reliable means of distinguishing between students who respond to instruction and those who do not.
(McMaster, Fuchs, Fuchs & Compton, 2002) - Unlike the IQ-achievement discrepancy model, the use of both criteria (performance level and rate of growth) to determine academic progress avoids gender bias or the overrepresentation of specific ethnic groups in special education services.
(Speece, 2005)
 To assess progress, teachers need to examine students’ CBM data at the end of the predetermined Tier 2 monitoring period (a recommended minimum of 10 weeks). Teachers will examine both performance level and rate of growth for only the Tier 2 portion of the graph and will decide whether students are making progress based on the following guidelines:
- Students are making adequate progress if their scores are at or above the established criterion for either performance level or rate of growth
- Students are not making adequate progress if their scores fall below the criteria for both performance level and rate of growth
The table below summarizes this decision making process.
| Performance Level | Rate of Growth | Outcome | |
| Meets Criteria |
Yes | Yes | Making adequate progress |
| Yes | No | Making adequate progress | |
| No | Yes | Making adequate progress | |
| No | No | Not making adequate progress; needs more intensive services |
It is important to note that there is no set sequence for the evaluation of performance level and rate of growth. For the purposes of this module, an order has been imposed on this process (see steps below) because experience indicates that it is more common for students to meet their performance-level expectations (i.e., benchmark) than to meet their rate-of-growth expectations (i.e., slopes). In effect, evaluating performance level may first reduce the amount of work teachers have to do to make tier decisions.
As they evaluate how their students respond to Tier 2 intervention, teachers should do the following:
Step 1: Evaluate the performance level for each struggling student.
- If a student’s performance level meets or exceeds the relevant benchmark

- If a student’s performance level does not meet the benchmark
 go to Step 2
Step 2: Evaluate the rate of growth.
- If a student’s slope meets or exceeds the established rate of growth
- If a student’s slope does not meet the established rate of growth provide Tier 3 intensive, individualized instruction
In Summary
If the student’s performance level is equal to or greater than the established benchmark or if the student’s rate of growth (slope) is equal to or greater than the specified rate of growth (e.g., 1.8 on the first-grade Vanderbilt University WIF probe), the student is responding adequately to instruction.
On the other hand, if the student’s performance level and rate of growth are less than the specified criteria, more intensive instruction is warranted.
Universal Screening: Did this student demonstrate adequate reading performance on the screening? If not, monitor Tier 1 progress.
Assessing Tier 1 Response: Is this student responding adequately to general education classroom instruction? If not, implement Tier 2 intervention.
Assessing Tier 2 Response: Is this student responding adequately to targeted intervention? If not, implement Tier 3 intervention.
For Your Information
Communicating with Students
When they view their academic growth in an easily understood format (e.g., on a graph), students can see the relationship between their effort and their progress. Graphs:
- Offer students a visual representation of their progress
- Demonstrate that hard work pays off
- Motivate students to maintain their efforts or to work harder
Communicating with Parents
CBM data are an excellent resource to use when communicating student progress to parents. During a parent-teacher meeting, teachers can clearly demonstrate:
- How the student is progressing compared to his or her past achievement
- What goals the student is expected to meet by the end of the school year