How will teachers initially identify struggling readers?
Page 5: The Tier 1 Decision-Making Process
On the previous page, we discussed how to implement progress monitoring in Tier 1. Next, the teacher uses these data to evaluate whether students are making adequate progress in the general education classroom and to make tier decisions.
rate of growth
glossary
performance level
glossary

In Tier 1, teachers should evaluate student progress using either rate of growth or performance level, both of which can be tracked using curriculum-based measurement. After a predetermined monitoring period—typically 5 to 10 weeks (or a minimum of five data points)—the teacher examines each student’s CBM data. If a student is performing at or above the established criterion for performance level or at or above the established criterion for rate of growth, he or she is making adequate progress. Each of these methods of evaluating students’ performance is described below. Once again, the school or district will determine the evaluation method a teacher may use.
Rate of Growth
Rate of growth is an indicator of the extent to which a student’s reading skills are improving. It is usually represented by the slope of a student’s graphed scores.
Determine the Slope
The criteria for evaluating rate of growth will also vary depending on the progress monitoring measure being used. Each progress monitoring measure specifies the rates of growth that indicate an adequate response to intervention for that measure. These criteria vary for each type of probe and for each grade level. Additionally, teachers and schools may purchase CBM graphing software that graphs student data and helps interpret the data for teachers.
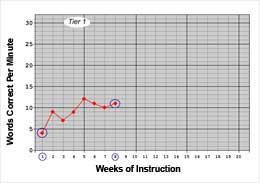 Once a student’s scores are plotted for a minimum of five weeks, a student’s slope can be determined with a simple calculation. You will need the following pieces of information:
- The score on the first probe
- The score on the last probe
- The first administration (e.g., week 1)
- The last administration (e.g., week 8)
To calculate slopes for the students in your class, click here to access the user-friendly IRIS Slope Calculator.
Evaluate Student Rate of Growth
Next, the teacher should compare each student’s slope to the rate of growth specified by the progress monitoring measure being used:
- A student’s slope that is equal to or greater than the specified rate of growth (e.g., 1.8 on the first-grade Vanderbilt University WIF probe) indicates that the student is responding adequately to instruction.
- On the other hand, a student’s slope that is less than the specified rate of growth indicates that more intensive instruction (e.g., Tier 2) is warranted.
Activity
 Let’s practice. Help Phoebe, a first-grade teacher at Rosa Parks, calculate the slope of Ian’s reading progress and evaluate his rate of growth. Click here to begin.
Performance Level
Performance level is an indication of a student’s reading skills, often denoted by a score on a given test or probe. It is usually represented on the vertical (or y-axis) on a graph of the student’s scores.
Identify Expected Performance Level
In order to evaluate a student’s performance level, the teacher needs to have a criterion, sometimes referred to as a benchmark, with which to compare it. The criteria for evaluating a student’s progress will vary depending on the progress monitoring measure being used. Each progress monitoring measure specifies the benchmarks that indicate an adequate response to intervention for that measure. These criteria also vary for each type of probe and for each grade level.
Alternatively, the teacher can calculate a short-term goal for each student.
To determine the short-term goal, the teacher must have the following pieces of information in hand:
- The end-of-year benchmark
- The student’s average CBM score on the first three probes
- The number of weeks left in the school year
- The number of weeks of monitoring
The table below outlines step-by-step directions for calculating a short-term goal.
| Calculation Directions | Example | |
|---|---|---|
| Step 1 | Determine the minimum number of words that the student needs to gain across the year. |
Example: |
| Step 2 | Determine the number of weeks left in the school year. | Example: |
| Step 3 | Determine the minimum number of words that the student needs to achieve each week in order to meet the end-of-year benchmark. | Divide the minimum number of words that the student needs to gain across the year by the number of weeks left in the school year.
Example: |
| Step 4 | Determine the word gain, that is how many more words the student should be able to read at the end of the monitoring period. | Multiply the weekly gain (.58) by the number of weeks the student is monitored (e.g., 10). This process indicates the number of words the student needs to gain by the end of the monitoring period.
Example: After 10 weeks of monitoring, the student needs to read 6 more words than he or she was reading at the beginning of the monitoring period. |
| Step 5 | Determine the short-term goal. | Add the short-term gain (6) to the student’s initial score (16 wcpm).
Example: At the end of 10 weeks of progress monitoring, the student should be reading 22 wcpm. |
For your convenience, a user-friendly Short-Term Goal Calculator is available in the Teacher’s Materials Center on Perspectives & Resources Page 5. ![]()
For Your Information
One benefit of identifying a short-term goal or benchmark for each student being monitored is that students are typically more motivated when they have an established goal to work toward.
Evaluate Student Performance Level
At the end of the Tier 1 monitoring period, the teacher compares each student’s performance level to the benchmark specified by the measure being used. To do this, he or she needs to examine each student’s graph and to calculate the student’s average score on the three most recent probes:
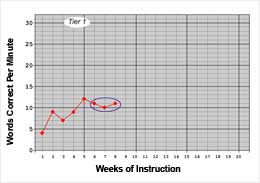
- If a student’s average score on the last three probes is equal to or greater than the benchmark, the student is responding adequately to instruction.
- On the other hand, if a student’s score is less than the specified benchmark, more intensive instruction (e.g., Tier 2) is warranted.
Activity
 Let’s practice. Help Phoebe evaluate the performance level of one of her students, Ian. Click here to begin.
The resources in the box below may be helpful to teachers implementing RTI.