RTI (Part 4): Putting It All Together
Assessment
Take some time now to answer the following questions. Please note that the IRIS Center does not collect your Assessment responses. If this is a course assignment, turn it in using your professor’s preferred method. If you have trouble answering any of the questions, go back and review the Perspectives & Resources pages in this module.
 Imagine that you are a third-grade teacher who has been preparing to implement the RTI approach. You have one week to get ready for class before school begins. List and describe at least five things that you would do to prepare for the students’ arrival and to implement RTI during the upcoming year.
- Given a 90-minute reading period, create your own daily reading schedule (do not duplicate the schedule used by Mr. Brewster).
- Be sure to include different grouping formats (i.e., whole-group instruction, small-group instruction, partner reading, independent practice).
- Describe when progress monitoring will occur during your schedule.
- Discuss at least one benefit of the general education teacher communicating with each of the following groups of people about the RTI approach:
- Other professionals
- Students
- Parents
- Choose a grade (K–3) and develop a 20-minute small-group lesson plan that covers the core reading components—be sure to specify the ability level and number of students. You may refer to the table below to determine which of the five core reading components need to be covered. Keep in mind that the table provides a guideline for students of typical ability. If you decide that a component does not need to be covered, write “0” in the Time Allotted column and justify your reasoning in the Brief Activity Description column.
| Reading Component | Kindergarten | First Grade | Second Grade | Third Grade |
| Phonemic Awareness | ||||
| Phonics and Word Study | ||||
| Fluency | ||||
| Vocabulary | ||||
| Reading Comprehension |
National Reading Panel, 2000; Texas Essential Knowledge and Skills (TEKS)
| Teachers Name: Grade: | ||
| Group Description: (include ability level and number of students) | ||
| Lesson Plan Components: | ||
| Core Reading Component | Time Allotted | Brief Activity Description: |
| Phonemic Awareness | ||
| Phonics and Word Study | ||
| Vocabulary | ||
| Fluency | ||
| Comprehension | ||
- Sierra and Ben are in second grade at Rosa Parks Elementary. Their Tier 2 provider, Ms. Washington, uses the PRF to monitor their progress. Examine the graphs below.
- Make a tier decision (i.e., initiate or discontinue) for each student.
- Justify your decision using the data in the graphs.
Remember, the criteria for the PRF are a benchmark of 35 and a slope greater to or equal to 1.
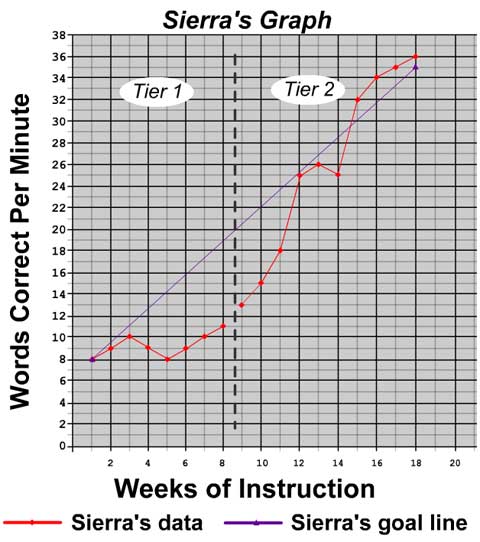
Sierra’s Graph: This is a line plot graph of Sierra’s data. The x-axis is labeled “Weeks of Instruction.” Weeks 0 through 20 are shown, with every two weeks labeled on the axis. There is a dividing, black-dashed line after week 8 to divide Tier 1 from Tier 2 instruction. The y-axis is labeled “Words Correct Per Minute.” 0 to 38 correct words per minute are shown, with every two words correct per minute labeled on the axis. There are two line plot graphs over Tier 1 and 2 instruction. The red graph shows Sierra’s data and the purple graph shows Sierra’s goal line. These graph indications are shown in the key underneath the graph. Sierra’s goal line begins at eight words correct per minute and stretches to 36 words correct per minute by Week 18. Sierra’s Tier 1 data has eight plotted points at weeks 1 through 8. The points per week are as follows: 8, 9, 10, 9, 8, 9, 10, and 11 words correct per minute. Sierra’s Tier 2 data has 10 plotted points, beginning at week 9 and ending at week 18. The points per week are as follows: 13, 15, 18, 25, 26, 25, 32, 34, 35, and 36.
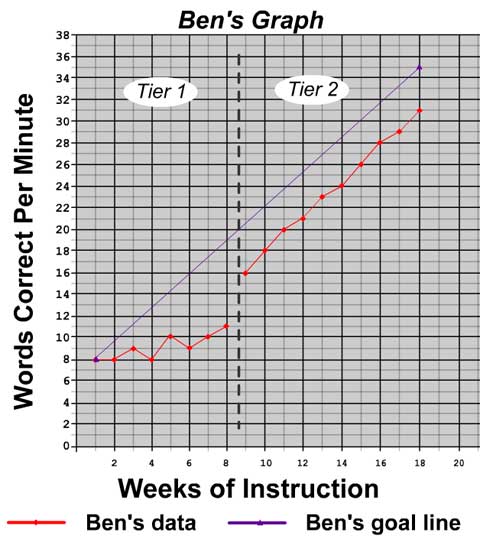
Ben’s Graph: This is a line plot graph of Ben’s data. The x-axis is labeled “Weeks of Instruction.” Weeks 0 through 20 are shown, with every two weeks labeled on the axis. There is a dividing, black-dashed line after week 8 to divide Tier 1 from Tier 2 instruction. The y-axis is labeled “Words Correct Per Minute.” 0 to 38 correct words per minute are shown, with every two words correct per minute labeled on the axis. There are two line plot graphs over Tier 1 and 2 instruction. The red graph shows Ben’s data and the purple graph shows Ben’s goal line. These graph indications are shown in the key underneath the graph. Ben’s goal line begins at eight words correct per minute and stretches to 35 words correct per minute by Week 18. Ben’s Tier 1 data has eight plotted points at weeks 1 through 8. The points per week are as follows: 8, 8, 9, 8, 10, 9, 10, and 11 words correct per minute. Sierra’s Tier 2 data has 10 plotted points, beginning at week 9 and ending at week 18. The points per week are as follows: 16, 18, 20, 21, 23, 24, 26, 28, 29, and 31.
To learn more about which students will receive Tier 3 intervention, components of Tier 3 reading interventions, and students’ response to this individualized intervention, proceed to the following IRIS Module: