How can the Rosa Parks teachers effectively implement the RTI components in each tier?
Page 5: Tier 1
Mr. Brewster provides 90 minutes of reading instruction every day, during which he incorporates the core reading program, high-quality instructional practices, and frequent progress monitoring. During the instructional period, he uses whole- and small-group instruction, paired instruction, learning centers, and independent practice.

How much time is spent during the week on each component?
| Reading Component |
Monday | Tuesday | Wednesday | Thursday | Friday | Weekly Total |
|---|---|---|---|---|---|---|
| Phonological Awareness | ||||||
| Phonics/Word Study | ||||||
| Fluency | ||||||
| Vocabulary | ||||||
| Comprehension |
How much time is spent during the week in each grouping format?
| Grouping Format |
Monday | Tuesday | Wednesday | Thursday | Friday | Weekly Total |
|---|---|---|---|---|---|---|
| Whole group | ||||||
| Partners | ||||||
| Same-ability small groups |
||||||
| Mixed-ability small groups |
||||||
| Independent Work |
Possible issues:
Given these initial analyses, possible changes that you’d like to make:
(Vaughn Gross Center for Reading and Language Arts at The University of Texas at Austin, 2006. University of Texas System/ Texas Education Agency)
Although Mr. Brewster was worried about having to teach reading for a 90-minute period, he soon realizes that the 90 minutes allow him more opportunities to differentiate instruction and to employ different grouping formats.
| Low-Performing Group | Middle-Performing Group | High-Performing Group | |
| Whole-Group Instruction | Compound Words | ||
| Small-Group Instruction | Book A Reading Lesson 10 (/oo/ sounds): Moon Boots | Book B Reading Lesson 10 (/ou/ sounds): How Much is a Thousand Pounds? | Book C Reading Lesson 9 (igh): The Brightest Idea |
| Story Center |
|
|
|
| Learning Center |
Choose ONE of the following activities:
|
Choose ONE of the following activities:
|
Choose ONE of the following activities:
|
| Paired Instruction | Students work with partners to practice reading fluency. | ||
| Independent Practice | Story worksheets from Lesson 10. | Story worksheets from Lesson 10. | Story worksheets from Lesson 9. |
The following section describes in more detail how Mr. Brewster implements this lesson plan. Throughout the section, links provide information for each grouping format contained in this 90-minute instructional period.
Providing 90 Minutes of High-Quality Instruction
Whole-Group Instruction (10 minutes)
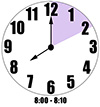 (8:00 to 8:10) |
Mr. Brewster spends the first 10 minutes of reading instruction leading whole-group activities. Mr. Brewster likes to start his reading class with a whole-group activity because he feels that this provides a common focus in reading across all the groups. Additionally, it allows the students, regardless of reading-ability level, to interact and contribute to discussions (e.g., a student with a learning disability can brainstorm a number of high-level ideas, even though he or she has difficulty reading written text).
This whole-group lesson focuses on compound words (core reading component: phonics and word study). Mr. Brewster explains what compound words are and gives examples that are appropriate for the three reading levels: low-, middle-, and high-performing readers (e.g., “into,” “doghouse,” and “underground”). Next, he asks his students to come up with their own examples of compound words, and he writes those on the board, as well. Finally, Mr. Brewster provides the students with non-examples and has them make the words into real compound words (e.g., “shoeplace” versus “shoelace”; “starglasses” versus “sunglasses”). |
Small-Group Instruction/Learning Activities (60 minutes)
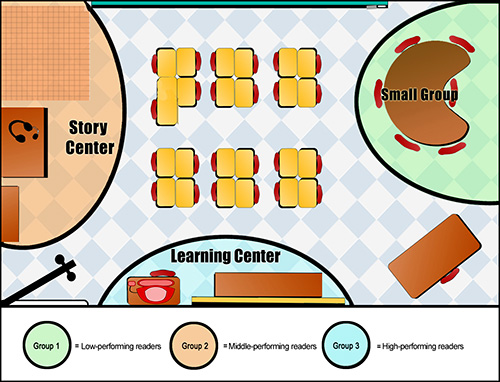
This 60-minute period is broken into three 20-minute sessions. During each session, Mr. Brewster provides instruction to one small group, while the other students are engaged in learning-center activities. Mr. Brewster creates two learning centers. The first, which he refers to as the story center, is devoted to vocabulary. Within this center, Mr. Brewster has provided a variety of listening, reading, and writing activities that reinforce vocabulary skills. The second learning center incorporates a variety of reading activities that address key reading skills. As noted previously, Mr. Brewster formed these small groups using the universal screening data, dividing the students according to their performance levels (same-ability grouping): low, middle, and high.
Note: This is only one method of how to implement small-group instruction.
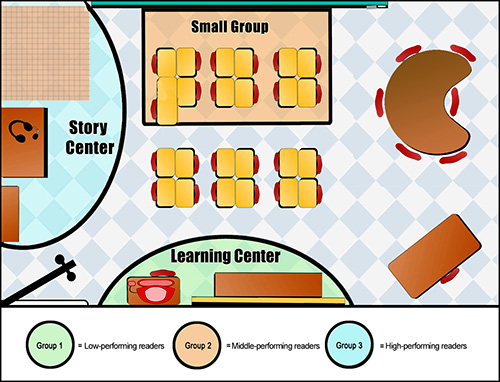
First 20-minute session
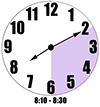 (8:10 to 8:30) |
During this first 20-minute session, notice that Group 1 is working at the small-group table, Group 2 is working on the story-center activities, and Group 3 is working on learning-center activities. To see more information on the lesson plan and activities that the three groups will be engaged in during the first 20-minute session, click on each of the links (i.e., small group, story center, learning center) below the diagram.
Note: Classroom diagram not to scale Group 1 small-group instruction lesson planBook A Reading Lesson 10 (/oo/ sounds): Moon Boots Group 2 story-center lesson plan
Group 3 learning-center lesson planChoose ONE of the following activities:
|
Second 20-minute session
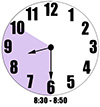 (8:30 to 8:50) |
During this second 20-minute session, notice that Group 1 moves to the learning center, Group 2 works with Mr. Brewster in small-group instruction at their desks, and Group 3 works on story-center activities. To see more information on the lesson plans and activities that the three groups will be engaged in during the second 20-minute session, click on each of the links (i.e., small group, story center, learning center) below the diagram.
Note: Classroom diagram not to scale Group 1 learning-center lesson planChoose ONE of the following activities:
Group 2 small-group instruction lesson planBook B Reading Lesson 10 (/ou/ sounds): How Much is a Thousand Pounds? Group 3 story-center lesson plan
|
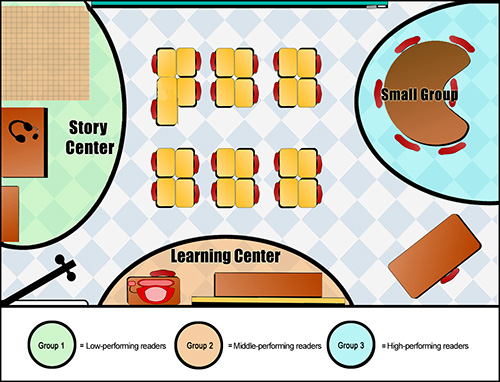
Third 20-minute session
 (8:50 to 9:10) |
During the final 20-minute session, Group 1 moves to the story center, Group 2 completes learning-center activities, and Group 3 receives small-group instruction at the table with Mr. Brewster. The diagram below depicts the student movement within the classroom for the third 20-minute reading session. Click on each of the links (i.e., small group, story center, learning center) below the diagram to see what the students will be doing during this time period.
Note: Classroom diagram not to scale Group 1 story-center lesson plan
Group 2 learning-center lesson planChoose ONE of the following activities:
Group 3 small-group instruction lesson planBook C Reading Lesson 9 (igh): The Brightest Idea |
Keep in Mind
The grouping format described above is one example of how teachers might group their students. The type of grouping practices a teacher uses should be related to the core reading program being used in the classroom and will vary from school to school. Additionally, once teachers can effectively manage learning centers, the teacher may incorporate mixed-ability grouping in centers. For example, students from Group 2 and Group 3 may work together at the same center while Mr. Brewster provides small-group instruction to Group 1.
Many teachers think the management of learning centers can be challenging, particularly when planning meaningful activities and holding students accountable for their work. Listen as Thea Woodruff provides helpful hints for the successful implementation of learning centers (time: 1:09).

Thea Woodruff, PhD
Director, Professional Development and Technical Assistance Teams,
Vaughn Gross Center’s Reading First Project
University of Texas, Austin
Transcript: Thea Woodruff, PhD
Basically, what you’re talking about with accountability is that students should be able to do whatever it is you want them to do. So you need to have an objective for the center and then you need to have some way of being able to tell: Did the student meet that objective? Whether that is a product that the student or the students together create at the center, or if you meet with them after the center to check in to see if they were able to do what they were supposed to do at the center, or gain whatever knowledge or skill it was you wanted them to gain or practice at the center . . . whatever you want kids to do in the center, you have to model it up front. You have to really show kids what they’re going to be doing at the center. And if you don’t do that, and if you don’t train them up front about how to use centers and be at centers and work together, it’s really not going to work. And that’s why centers are so difficult for teachers to really do, because it takes a lot of time, a lot of preparation up front, and as you’re putting the centers together to try to figure out. Once you kind of figure out centers, you kind of get them planned out, you can keep them the same and just put different materials there and different extension activities and things like that.
Paired Instruction (10 minutes)
 (9:10 to 9:20) |
The next segment of Mr. Brewster’s reading schedule is partner reading, in which all students in the class are paired to practice reading fluency. The students take turns reading a short passage to each other. Mr. Brewster walks throughout the classroom, observing each pair of students, occasionally providing feedback on their reading and their partnering skills. |
 Mr. Brewster paired his students using their fall universal screening scores and the rank-ordering method discussed in RTI (Part 3): Reading Instruction.
|
|
Step 3: Move halves next to each other
|
|
As a result of using this method, the student pairs reflect mixed-ability grouping.
The video clip below provides an example of a partner-reading activity and includes a student’s perspective on this type of instruction. This example highlights Peer-Assisted Learning Strategies (PALS), a structured, peer-mediated reading activity appropriate for students in grades 2-8 (time: 1:40).
Transcript: Paired Instruction
Paired instruction is an effective grouping method that can be used to reinforce reading skills. In this example, students take turns reading a passage to each other and providing corrective feedback. The students in this classroom work well in pairs and are actively engaged in instruction. While the students are working together, the teacher walks around the classroom monitoring the partners’ interactions and individual students’ performances.
Now, watch as two students participate in a partner-reading activity. Notice how the procedure incorporates corrective feedback and role-reversal.
In this last video clip, one student describes his partner-reading experience.
Independent Work (10 minutes)
 (9:20 to 9:30) |
During the final 10 minutes of class, all of Mr. Brewster’s students work independently on various activities and worksheets that reinforce the reading skills addressed in small-group instruction. |
Progress Monitoring
During Tier 1, progress monitoring data should be collected for 6-10 weeks.
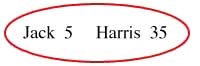
While the students are engaged in independent work, Mr. Brewster collects weekly progress monitoring data. Because he collects data for each student in his classroom (excluding Jack), not just those whose universal screening data indicated that they were struggling readers, he assesses 4 to 5 students per day.
Now that the students are in second grade, the Word Identification Fluency (WIF) probe is no longer appropriate for most students. Instead, Mr. Brewster uses Passage Reading Fluency (PRF), which is more appropriate to assess the skills of second-grade students. This measure assesses students’ abilities to read sentences, paragraphs, and passages. For the assessment, each student reads a passage for one minute while Mr. Brewster records the number of words he or she reads correctly.
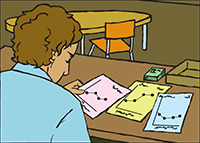
Activity

Click on the picture of Irina, one of Mr. Brewster’s students, to practice administering a PRF probe.
Irina’s PDF Probe
27
41
57
69
77
84
100
115
129
143
155
158
172
185
Oneday,Dadhadcomehomefromworktosaythattheywouldhaveto
movefaraway.Dadworkedinafactory.ThefactoryhadclosedandDad
neededanewjob.. Dadhadfoundanewjobandnowtheyhadtomove.
Raymondwassadbecausehedidnotwanttoleavehisschool.
Hedidnotwanttoleavehisfriends.
“It is OK,” said Raymond with a smile. He did not want Dad to feel bad.
They packed up the car and moved to a new state. Their new house was
old and scary. “I wonder whether there are any ghosts living in our house,”
said Raymond. The house was big and dark. The front of the house was
covered by trees. Even the trees looked scary. The blowing breeze made
them look alive.
Inside the house was dark, so Dad fixed the lights and turned them on.
Then they unpacked the car and Raymond went up to his new room.
Making Tier Decisions
 After 8 weeks of collecting progress monitoring data, Mr. Brewster evaluates the results for Laney, Paloma, Sammy, Adam, and LaToya—the students who were identified by the universal screening as having potential reading difficulties. Mr. Brewster will not make a tier placement decision for Jack because he is already receiving Tier 3 services. Mr. Brewster begins by examining each of his struggling students’ graphs. To evaluate a student’s progress and to make a tier placement decision, Mr. Brewster will review the progress monitoring data collected. He will examine the student’s rate of growth (slope), which will indicate how much the student’s reading skills have increased each week.
Below is an example of Paloma’s graph and how to use the data to make a tier placement decision.
Paloma
The score on the first probe — 10
The score on the last probe — 14
The first administration time period — week 1
The last administration time period — week 8
Slope = Click here to calculate Paloma’s slope.
Paloma’s rate of growth is .57. The criterion for adequate progress on the PRF is a rate of growth (or slope) equal to or greater than one. The data indicate that Paloma would benefit from Tier 2 intervention.
Mr. Brewster compares each student’s slope to the rate of growth specified by the progress monitoring measure being used:
- If the student’s slope is equal to or greater than the specified rate of growth (e.g., a slope of greater than or equal to 1 on the second-grade PRF probe), the student is responding adequately to instruction.
- On the other hand, if the student’s slope is less than the specified rate of growth, more intensive instruction, like that provided in Tier 2, is warranted.
Two of the six struggling students have specific learning needs. Jack was identified with a learning disability in first grade and has an IEP. He will continue receiving Tier 3 intervention (special education services) from Ms. Jacobs. Mr. Brewster will meet often with Ms. Jacobs to discuss Jack’s progress. Sammy was identified with ADHD in first grade and has a 504 plan. After discussing Sammy’s reading skills and his progress monitoring data, Mr. Brewster and the S-Team believe that Sammy can make adequate progress in the general education classroom with a few accommodations. The remaining students did not make adequate progress in Tier 1, as indicated by their rates of growth (slope) on the progress monitoring data.
504 plan
A plan that specifies the accommodations and modifications necessary for a student with a disability to attend school with his or her peers; named for Section 504 of the Rehabilitation Act of 1973, which prohibits discrimination against individuals with disabilities, ensuring that children with disabilities have equal access to public education; students with 504 Plans do not meet the eligibility requirements for special education under IDEA.
 Remember:
- At Rosa Parks, second-grade students are typically monitored using the PRF.
- If a student’s slope is greater than or equal to 1 on the PRF, he or she is making adequate progress.
- Jack is monitored using the WIF.
If you would like practice calculating the slope for each student in the table below, click here for a slope calculator. (The PRF slope criterion is 1; the WIF slope criterion is 1.8.)
| Student | Progress Monitoring Data | RTI Tier 1 Decision |
 |
This is a line plot graph of Jack’s Tier 3 CBM data. The x-axis is labeled “Weeks of Instruction.” Weeks 0 through 8 are shown, with every week labeled on the axis. The y-axis is labeled “Words Correct Per Minute.” 0 to 70 correct words per minute are shown, with every 10 words correct per minute labeled on the axis. There are two line plot graphs during this Tier 3 instruction. The red graph shows Jack’s data and the purple graph shows Jack’s goal line. These graph indications are shown in the key underneath the graph. Jack’s goal line begins at 30 words correct per minute and stretches to 60 words correct per minute by Week 8. Jack’s data has eight plotted points at weeks 1 through 8. The points per week are as follows: 30, 31, 32, 35, 38, 40, 41, and 45 words correct per minute. (Jack’s slope = 2.14) |
|
 |
This is a line plot graph of Laney’s Tier 1 CBM data. The x-axis is labeled “Weeks of Instruction.” Weeks 0 through 8 are shown, with every week labeled on the axis. The y-axis is labeled Words Correct Per Minute. 0 to 16 correct words per minute are shown, with every two words correct per minute labeled on the axis. There are two line plot graphs during this Tier 1 instruction. The red graph shows Laney’s data and the purple graph shows Laney’s goal line. These graph indications are shown in the key underneath the graph. Laney’s goal line begins at 6 words correct per minute and stretches to 15 words correct per minute by Week 8. Laney’s data has 8 plotted points at weeks 1 through 8. The points per week are as follows: 6, 7, 8, 7, 8, 9, 10, and 9 words correct per minute. (Laney’s slope = .43) |
|
 |
This is a line plot graph of Paloma’s Tier 1 CBM data. The x-axis is labeled Weeks of Instruction. Weeks 0 through 8 are shown, with every week labeled on the axis. The y-axis is labeled “Words Correct Per Minute.” 0 to 16 correct words per minute are shown, with every two words correct per minute labeled on the axis. There are two line plot graphs during this Tier 1 instruction. The red graph shows Paloma’s data and the purple graph shows Paloma’s goal line. These graph indications are shown in the key underneath the graph. Paloma’s goal line begins at 10 words correct per minute and stretches to 15 words correct per minute by Week 8. Paloma’s data has eight plotted points at weeks 1 through 8. The points per week are as follows: 10, 10, 11, 12, 11, 12, 13, and 14 words correct per minute. (Paloma’s slope = .57) |
|
 |
This is a line plot graph of Sammy’s Tier 1 CBM data. The x-axis is labeled “Weeks of Instruction.” Weeks 0 through 8 are shown, with every week labeled on the axis. The y-axis is labeled “Words Correct Per Minute.” 0 to 16 correct words per minute are shown, with every two words correct per minute labeled on the axis. There are two line plot graphs during this Tier 1 instruction. The red graph shows Sammy’s data and the purple graph shows Sammy’s goal line. These graph indications are shown in the key underneath the graph. Sammy’s goal line begins at eight words correct per minute and stretches to 15 words correct per minute by Week 8. Sammy’s data has eight plotted points at weeks 1 through 8. The points per week are as follows: 8, 10, 11, 9, 12, 15, 12, and 11 words correct per minute. (Sammy’s slope = .43) |
|
 |
This is a line plot graph of LaToya’s Tier 1 CBM data. The x-axis is labeled “Weeks of Instruction.” Weeks 0 through 8 are shown, with every week labeled on the axis. The y-axis is labeled “Words Correct Per Minute.” 0 to 16 correct words per minute are shown, with every two words correct per minute labeled on the axis. There are two line plot graphs during this Tier 1 instruction. The red graph shows LaToya’s data and the purple graph shows LaToya’s goal line. These graph indications are shown in the key underneath the graph. LaToya’s goal line begins at 10 words correct per minute and stretches to 15 words correct per minute by Week 8. LaToya’s data has eight plotted points at weeks 1 through 8. The points per week are as follows: 10, 11, 12, 11, 10, 11, 12, and 12 words correct per minute. (LaToya’s slope = .29) |
|
Activity
The final struggling reader in Mr. Brewster’s class is Adam. Help Mr. Brewster evaluate the performance level and rate of growth for Adam and make a placement decision based on the data. Click on Adam’s picture to complete this activity.
-
- Is his rate of growth adequate?
- Is Adam responding adequately to instruction? On the chart below, click “Yes” or “no” to indicate whether or not Adam is making adequate progress.
After evaluating the data, Mr. Brewster determines that Laney, Paloma, Adam, and LaToya would benefit from targeted instruction provided in Tier 2, in addition to Tier 1 instruction.