What other considerations should Mr. Brewster and the other school professionals be aware of when implementing RTI?
Page 8: Initiating and Discontinuing Intervention
Making decisions about when and whether students should begin or end intervention is inherent to the multi-tiered RTI approach. Such decisions must take into account each students’ needs and the resources available within each school or district. It is critical that the school or district establish the criteria and guidelines that will be used to determine tier decisions before teachers begin to implement the RTI approach. These criteria and guidelines may be influenced by the primary purpose for which the school is implementing RTI. The two primary purposes of RTI, given a three-tiered model, are outlined below.
RTI Purposes

Provide early intervening services to students who are struggling
The decision-making process will provide students with needed support as early as possible. The length of intervention may be determined by a number of factors (e.g., school resources).
Identify students with learning disabilities
The decision-making process will move students through the tiers of intervention in a timely manner (in order to comply with legal mandates) to determine whether the students have learning disabilities and whether they qualify for special education services.
Regardless of the RTI purpose, school personnel will make two basic decisions within the RTI approach: when to initiate an intervention and when to discontinue an intervention. In the following sections, these decision processes are summarized. Though they may seem somewhat redundant, it is important to note that these decision processes, at times, serve distinct functions, as is detailed in the table below.
| Tier Decision | Example |
| Begin intervention | After progress monitoring in Tier 1, LaToya begins Tier 2 intervention. |
| Begin and end intervention | After receiving Tier 2 intervention, Laney ends Tier 2 intervention and, at the same time, begins Tier 3 intervention. |
| End intervention | After receiving one round of Tier 2 intervention, Adam discontinues Tier 2 supports. |
Tier Initiation Decisions
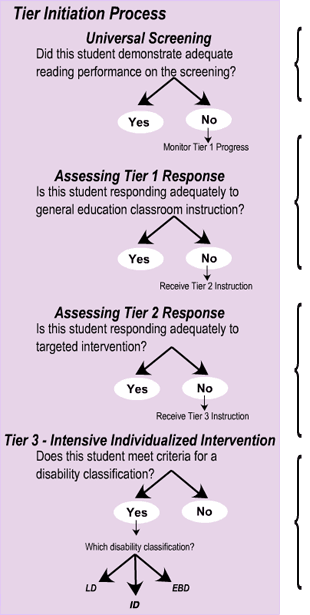
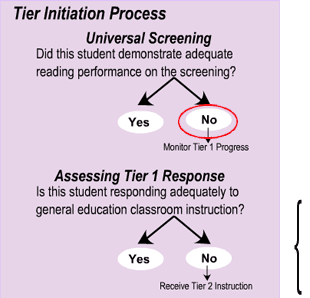
Teachers need to know the process for determining which students would benefit from the extra reading support provided by Tier 2 or Tier 3. The figure below summarizes the decision-making process for providing more intensive instruction to struggling readers.
All students receive a universal screening.
All students receive Tier 1 instruction.
Tier 1 Progress Monitoring:
The progress of students who do not meet criteria on the universal screening measure is monitored.
Students who do not respond adequately to Tier 1 instruction receive targeted intervention in Tier 2 (in addition to Tier 1 instruction).
Students who do not respond adequately to Tier 2 intervention receive intensive, individualized intervention in Tier 3 (in addition to Tier 1 instruction).
This flowchart figure summarizes the decision-making process for providing the different Tiers of instruction for response to intervention. The flowchart is titled “Tier Initiation Process.” The first step is Universal Screening, in which the following question is asked: “Did this student demonstrate adequate reading performance on the screening?” There are two arrows coming off this question pointing to either Yes or No. Under the No is a small arrow pointing to the text “Monitor Tier 1 Progress.” The second step is Assessing Tier 1 Response, where the following question is asked “Is this student responding adequately to the general education classroom instruction?” There are two arrows coming off this question pointing to either Yes or No. Under the No is a small arrow pointing to the text “Receive Tier 2 Instruction.” The third step is Assessing Tier 2 Response, in which the following question is asked “Is this student responding adequately to the targeted intervention?” There are two arrows coming off this question pointing to either Yes or No. Under the No is a small arrow pointing to the text “Receive Tier 3 Instruction.” The last step is Tier 3 – Intensive Individualized Intervention, where the following question is asked “Does this student meet criteria for a disability classification?” There are two arrows coming off this question pointing to either Yes or No. Under the No is a small arrow pointing to the question “Which disability classification?” Three arrows extend from this question pointing to LD, ID, and EBD, which stands for learning disability, intellectual disability, and emotional behavioral disorders.
Tier Discontinuation Decisions
 One purpose of the tiered RTI model is to support students who are experiencing reading difficulties. Students who successfully respond to Tier 2 or Tier 3 intervention and reach grade-level standards may discontinue the intervention. To discontinue an intervention, however, requires that there be some set criteria for students to meet at the end of an intervention period. Once again, the criteria should be determined at the school or district level prior to implementing the RTI approach.
Keep in Mind
When applying discontinuation criteria, it is important to ensure that an intervention does not end prematurely because it appears that the student has acquired the necessary support. By avoiding such a premature termination, schools will eliminate the issue of having students “ping-pong” back and forth between tiers. For example, if a student discontinues Tier 2 intervention too soon and has not truly mastered the requisite skills, then he or she will begin to fall behind when receiving Tier 1 instruction only. This, in turn, will result in the student’s receiving Tier 2 intervention again. For some students, ending intervention too soon can result in a continuous cycle of bouncing between tiers.
To determine whether a student is ready to discontinue an intervention, school personnel need to establish whether the student has acquired and can maintain newly mastered concepts and skills. In order to verify the student’s readiness, school personnel should examine the student’s progress monitoring data.
All students receive Tier 1 instruction throughout the year.
Students who respond adequately to Tier 2 instruction discontinue Tier 2 intervention and receive Tier 1 instruction only.
Note: Students who respond favorably to intervention but who have not quite met the established benchmark may receive another round of Tier 2 intervention.
Students who respond adequately to Tier 3 intervention may:
- Discontinue Tier 3 intervention and receive Tier 2 intervention to support the eventual transition to Tier 1 instruction only
- Discontinue Tier 3 intervention and receive Tier 1 instruction only
Note: When Tier 3 is special education, an IEP meeting must be held to change or discontinue intervention services.
benchmark
An indicator used to identify the expected understandings and skills needed for content standards by grade level; benchmarks are tracked according to predetermined time intervals (e.g., a mid-year benchmark).
round of intervention
A set period of time, determined by the school or district, during which an intervention is implemented.
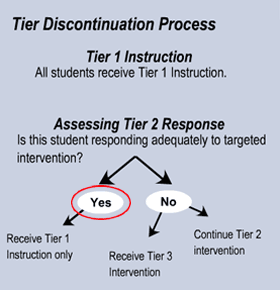
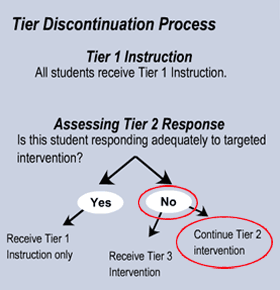
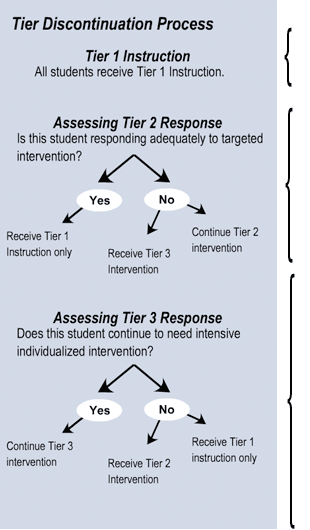
This flowchart figure summarizes the decision-making process for discontinuing different Tiers of instruction. The flowchart is titled “Tier Discontinuation Process.” The first step is Tier 1 Instruction, with the following text written below “All students receive Tier 1 Instruction.” The second step is Assessing Tier 2 Response, where the following question is asked “Is this student responding adequately to targeted intervention?” There are two arrows coming off this question pointing to either Yes or No. Under the Yes is a small arrow pointing to the text “Receive Tier 1 Instruction only.” Under the No are two small arrows pointing to either to “Receive Tier 3 Intervention” or “Continue Tier 2 Intervention.” The third step is Assessing Tier 3 Response, in which the following question is asked “Does this student continue to need intensive individualized intervention?” There are two arrows coming off this question pointing to either Yes or No. Under the Yes is a small arrow pointing to the text “Continue Tier 3 intervention.” Under the No are two small arrows pointing to either “Receive Tier 2 Intervention” or “Receive Tier 1 instruction only.”
For Your Information
It is critical to continue monitoring the progress of a student after he or she discontinues an intervention. In this way, a teacher can catch a student who is beginning to fall behind before the next universal screening time, and a decision can be made about providing additional support for the student either in Tier 1 or by moving him or her back into Tier 2.
Example Decisions
Though some schools may be required to adhere strictly to the tier initiation and discontinuation criteria, others might consider individual factors and may make the determination on a case-by-case basis. The information in the table below highlights the experiences of six of Mr. Brewster’s students in the RTI approach. To examine each tier decision more thoroughly, click on the student’s portrait below.
| Student | Tier Initiation Decision | Tier Discontinuation Decision | |||||||||||||||
[view data] |
Receives Tier 1 only | Not applicable | |||||||||||||||
|
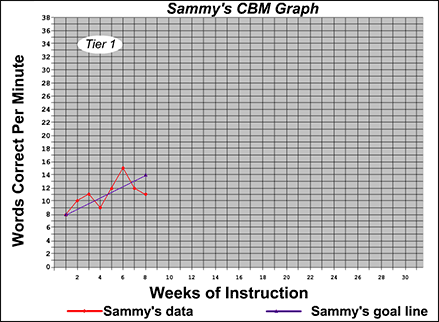
Sammy’s CBM Graph: This is a line plot graph of Sammy’s CBM data. The x-axis is labeled “Weeks of Instruction.” Weeks 0 through 30 are shown, with every two weeks labeled on the axis. The y-axis is labeled “Words Correct Per Minute.” 0 to 38 correct words per minute are shown, with every two words correct per minute labeled on the axis. There are two line plot graphs during Tier 1 instruction, which falls from Week 1 to Week 8. The red graph shows Sammy’s data and the purple graph shows Sammy’s goal line. These graph indications are shown in the key underneath the graph. Sammy’s goal line begins at 8 words correct per minute and stretches to 14 words correct per minute by Week 8. Sammy’s data has eight plotted points at weeks 1 through 8. The points per week are as follows: 8, 10, 11, 9, 12, 15, 12, and 11 words correct per minute. Rationale:Sammy was identified as having ADHD in first grade. His slope of .43 indicates that he is not making adequate progress in Tier 1 instruction this year. The S-Team believes that Sammy’s ADHD is contributing to the erratic nature of his scores on the PRF probes. The S-Team advises Mr. Brewster to try some instructional accommodations in Tier 1. Sammy’s progress will continue to be monitored and evaluated to determine whether he is making adequate progress with the accommodations or whether he would benefit from Tier 2 intervention.
Although Sammy did not make adequate progress, Tier 2 intervention was not recommended at this time. Sammy’s Tier Initiation Process: This flowchart figure summarizes the decision-making process for providing the different Tiers of instruction for response to intervention. The flowchart is titled “Tier Initiation Process.” The first step is Universal Screening, in which the following question is asked “Did this student demonstrate adequate reading performance on the screening?” There are two arrows coming off this question pointing to either Yes or No. Under the No is a small arrow pointing to the text “Monitor Tier 1 Progress.” No is circled in red, indicating that Sammy’s Tier 1 Progress will be monitored. The second step is Assessing Tier 1 Response, where the following question is asked “Is this student responding adequately to the general education classroom instruction?” There are two arrows coming off this question pointing to either Yes or No. Under the No is a small arrow pointing to the text “Receive Tier 2 Instruction.” To the side of this step the following text is written “Although Sammy did not make adequate progress, Tier 2 intervention was not recommended at this time.” (Close this panel) |
|||||||||||||||||
[view data] |
Begin Tier 2 | End Tier 2 |
|||||||||||||||
|
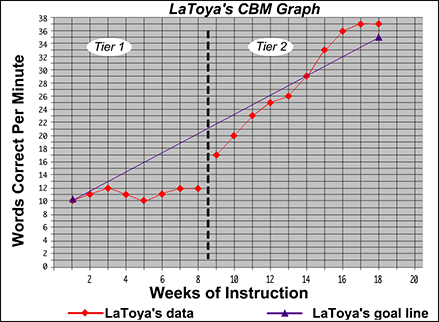
LaToya’s CBM Graph: This is a line plot graph of LaToya’s CBM data. The x-axis is labeled “Weeks of Instruction.” Weeks 0 through 20 are shown, with every two weeks labeled on the axis. There is a dividing, black-dashed line after week 8 to divide Tier 1 from Tier 2 instruction. The y-axis is labeled “Words Correct Per Minute.” 0 to 38 correct words per minute are shown, with every two words correct per minute labeled on the axis. There are two line plot graphs over Tier 1 and 2 instruction. The red graph shows LaToya’s data and the purple graph shows LaToya’s goal line. These graph indications are shown in the key underneath the graph. LaToya’s goal line begins at 10 words correct per minute and stretches to 35 words correct per minute by Week 18. LaToya’s Tier 1 data has eight plotted points at weeks 1 through 8. The points per week are as follows: 10, 11, 12, 11, 10, 11, 12, and 12 words correct per minute. LaToya’s Tier 2 data has 10 plotted points, beginning at week 9 and ending at week 18. The points per week are as follows: 17, 20, 23, 24, 25, 27, 29, 30, 34, and 37. Rationale:LaToya received two rounds of Tier 2 intervention last year (first grade). During the spring, she met criteria, exited Tier 2, and received Tier 1 instruction only. This year (second grade), her universal screening scores indicated that she again was having difficulty with reading. Mr. Brewster monitored her progress for eight weeks. LaToya’s scores had a slope of .29, and Mr. Brewster decided that she should receive Tier 2 intervention. During Tier 2 intervention, her slope increased to 2.22 and her performance level to 37, which surpass the criteria to discontinue Tier 2 intervention. LaToya will now again receive Tier 1 instruction only.
LaToya’s Tier Initiation Process: This flowchart figure summarizes the decision-making process for discontinuing different Tiers of instruction. The flowchart is titled “Tier Discontinuation Process.” The first step is Tier 1 Instruction, with the following text written below: All students receive Tier 1 Instruction. The second step is Assessing Tier 2 Response, where the following question is asked: Is this student responding adequately to targeted intervention? There are two arrows coming off this question pointing to either Yes or No. Under the Yes is a small arrow pointing to the text “Receive Tier 1 Instruction only.” Under the No are two small arrows pointing to the either “Receive Tier 3 Intervention” or “Continue Tier 2 Intervention.” Yes is circled in red, indicating that LaToya will receive Tier 1 Instruction only. Keep in MindIn the case of students like LaToya, who bounce in and out of Tier 2—receiving one round of Tier 2 intervention, then exiting Tier 2, then receiving another round of Tier 2—several points are worth considering:
(Close this panel) |
|||||||||||||||||
[view data] |
Begin Tier 2 | End Tier 2 |
|||||||||||||||
|
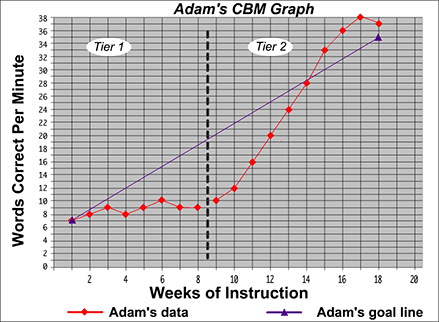
Adam’s CBM Graph: This is a line plot graph of Adam’s CBM data. The x-axis is labeled “Weeks of Instruction.” Weeks 0 through 20 are shown, with every two weeks labeled on the axis. There is a dividing, black-dashed line after week 8 to divide Tier 1 from Tier 2 instruction. The y-axis is labeled “Words Correct Per Minute.” 0 to 38 correct words per minute are shown, with every two words correct per minute labeled on the axis. There are two line plot graphs over Tier 1 and 2 instruction. The red graph shows Adam’s data and the purple graph shows Adam’s goal line. These graph indications are shown in the key underneath the graph. Adam’s goal line begins at 7 words correct per minute and stretches to 35 words correct per minute by Week 18. Adam’s Tier 1 data has eight plotted points at weeks 1 through 8. The points per week are as follows: 7, 8, 9, 8, 9, 10, 9, and 9 words correct per minute. Adam’s Tier 2 data has 10 plotted points, beginning at week 9 and ending at week 18. The points per week are as follows: 10, 12, 16, 20, 24, 28, 33, 36, 38, and 37. Rationale:Because both Adam’s performance level and slope exceed the PRF criteria, Mr. Brewster and Ms. Washington decide that Adam can exit Tier 2 intervention. They believe Adam can succeed with Tier 1 instruction only.
Adam’s Tier Initiation Process: This flowchart figure summarizes the decision-making process for discontinuing different Tiers of instruction. The flowchart is titled “Tier Discontinuation Process.” The first step is Tier 1 Instruction, with the following text written below: All students receive Tier 1 Instruction. The second step is Assessing Tier 2 Response, where the following question is asked “Is this student responding adequately to targeted intervention?” There are two arrows coming off this question pointing to either Yes or No. Under the Yes is a small arrow pointing to the text “Receive Tier 1 Instruction only.” Under the No are two small arrows pointing to the either “Receive Tier 3 Intervention” or “Continue Tier 2 Intervention.” Yes is circled in red, indicating that Adam will receive Tier 1 Instruction only. (Close this panel) |
|||||||||||||||||
[view data] |
Begin Tier 2 | Continues to receive Tier 2 | |||||||||||||||
|
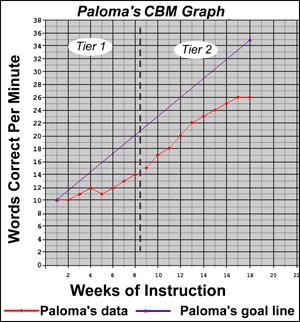
Paloma’s CBM Graph: This is a line plot graph of Paloma’s CBM data. The x-axis is labeled “Weeks of Instruction.” Weeks 0 through 22 are shown, with every two weeks labeled on the axis. There is a dividing, black-dashed line after week 8 to divide Tier 1 from Tier 2 instruction. The y-axis is labeled “Words Correct Per Minute.” 0 to 38 correct words per minute are shown, with every two words correct per minute labeled on the axis. There are two line plot graphs over Tier 1 and 2 instruction. The red graph shows Paloma’s data and the purple graph shows Paloma’s goal line. These graph indications are shown in the key underneath the graph. Paloma’s goal line begins at 10 words correct per minute and stretches to 35 words correct per minute by Week 18. Paloma’s Tier 1 data has eight plotted points at weeks 1 through 8. The points per week are as follows: 10, 10, 11, 12, 11, 12, 13, and 14 words correct per minute. Paloma’s Tier 2 data has 10 plotted points, beginning at week 9 and ending at week 18. The points per week are as follows: 15, 17, 18, 20, 22, 23, 24, 25, 26, and 26. Rationale:Paloma has not yet reached the grade-level benchmark of 35 words read correctly in one minute, but she is making progress in Tier 2 as evidenced by her slope. Even though Paloma’s data suggest that she could exit Tier 2 intervention, Mr. Brewster and Ms. Washington believe that Paloma would benefit from another round of Tier 2 intervention to allow her the opportunity to reach the desired benchmark of 35. With this support and her ESL instruction, Mr. Brewster and Ms. Washington believe that Paloma will reach the grade-level benchmark by the end of the second round of Tier 2 intervention.
Paloma’s Tier Initiation Process: This flowchart figure summarizes the decision-making process for discontinuing different Tiers of instruction. The flowchart is titled “Tier Discontinuation Process.” The first step is Tier 1 Instruction, with the following text written below “All students receive Tier 1 Instruction.” The second step is Assessing Tier 2 Response, where the following question is asked “Is this student responding adequately to targeted intervention?” There are two arrows coming off this question pointing to either Yes or No. Under the Yes is a small arrow pointing to the text “Receive Tier 1 Instruction only.” Under the No are two small arrows pointing to the either “Receive Tier 3 Intervention” or “Continue Tier 2 Intervention.” No is circled in red, then Continue Tier 2 Intervention is circled indicating that Paloma will continue to receive Tier 2 Intervention. (Close this panel) |
|||||||||||||||||
[view data] |
Begin Tier 2 | End Tier 2 |
|||||||||||||||
|
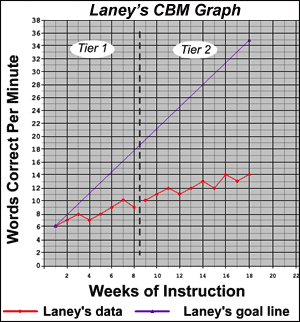
This is a line plot graph of Laney’s Tier 2 CBM data. The x-axis is labeled “Weeks of Instruction.” Weeks 0 through 22 are shown, with every two weeks labeled on the axis. There is a dividing, black-dashed line after week 8 to divide Tier 1 from Tier 2 instruction. The y-axis is labeled “Words Correct Per Minute.” 0 to 38 correct words per minute are shown, with every two words correct per minute labeled on the axis. There are two line plot graphs over Tier 1 and 2 instruction. The red graph shows Laney’s data and the purple graph shows Laney’s goal line. These graph indications are shown in the key underneath the graph. Laney’s goal line begins at six words correct per minute and stretches to 35 words correct per minute by Week 18. Laney’s Tier 1 data has eight plotted points at weeks 1 through 8. The points per week are as follows: 6, 7, 8, 7, 8, 9, 10, and 9 words correct per minute. Laney’s Tier 2 data has 10 plotted points, beginning at week 9 and ending at week 18. The points per week are as follows: 10, 11, 12, 11, 12, 13, 12, 14, 13, and 14. Rationale:Laney’s performance level and slope are both far below the PRF criteria. Mr. Brewster and Ms. Washington decide that Laney needs the more intensive, individualized intervention provided in Tier 3.
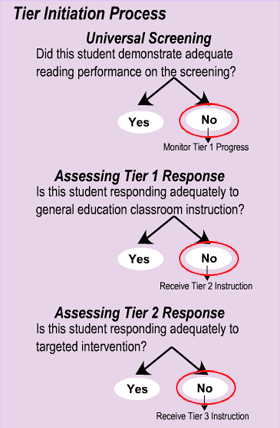
This flowchart figure summarizes the decision-making process for providing the different Tiers of instruction for response to intervention. The flowchart is titled “Tier Initiation Process.” The first step is Universal Screening, in which the following question is asked “Did this student demonstrate adequate reading performance on the screening?” There are two arrows coming off this question pointing to either Yes or No. Under the No is a small arrow pointing to the text “Monitor Tier 1 Progress.” The No is circled in red. The second step is Assessing Tier 1 Response, where the following question is asked “Is this student responding adequately to the general education classroom instruction?” There are two arrows coming off this question pointing to either Yes or No. Under the No is a small arrow pointing to the text “Receive Tier 2 Instruction.” The No is circled, indicating that Laney needed to receive Tier 2 Instruction. The third step is Assessing Tier 2 Response, in which the following question is asked “Is this student responding adequately to the targeted intervention?” There are two arrows coming off this question pointing to either Yes or No. Under the No is a small arrow pointing to the text: Receive Tier 3 Instruction. Again, No was circled indicating that Laney needs to receive Tier 3 Instruction. (Close this panel) |
|||||||||||||||||
[view data] |
Receives Tier 3 (beginning in first grade) |
Continues to receive Tier 3 | |||||||||||||||
|
Tier Initiation Decision–Began Tier 3 in first grade
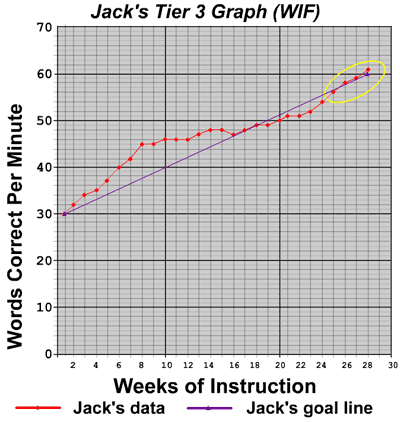
This is a line plot graph of Jack’s Tier 3 data. The x-axis is labeled “Weeks of Instruction.” Weeks 0 through 30 are shown, with every two weeks labeled on the axis. The y-axis is labeled “Words Correct Per Minute.” 0 to 70 correct words per minute are shown, with every 10 words correct per minute labeled on the axis. There are two line plot graphs during this Tier 3 instruction. The red graph shows Jack’s data and the purple graph shows Jack’s goal line. These graph indications are shown in the key underneath the graph. Jack’s goal line begins at 30 words correct per minute and stretches to 60 words correct per minute by Week 28. Jack’s data points fall above the goal line from week 2 through 16, then hover on the goal line through 18. His data points fall below the goal line from week 18 through 25, and then hover on the goal line for the last four weeks and move slightly above the goal line during the last week, week 28. The last four data points are circled in yellow, indicating that Jack’s most recent data is around the goal line. Rationale:Jack was identified as having a learning disability last year (first grade) and began receiving Tier 3 intervention. He will continue to receive Tier 3 intervention in second grade, and his progress will be monitored. During his annual IEP review, Jack’s performance will be evaluated by the IEP team to determine whether he needs to continue Tier 3 intervention in the following year.
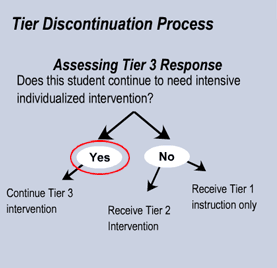
This flowchart figure summarizes the decision-making process for discontinuing different Tiers of instruction. The flowchart is titled “Tier Discontinuation Process.” The third step, Assessing Tier 3 Response, is shown and asks the following “Does this student continue to need intensive individualized intervention?” There are two arrows coming off this question pointing to either Yes or No. Under the Yes is a small arrow pointing to the text “Continue Tier 3 intervention.” Under the No are two small arrows pointing to either “Receive Tier 2 Intervention” or “Receive Tier 1 instruction only.” Yes is circled in red, indicating that Jack will continue to receive Tier 3 Intervention. (Close this panel) |
|||||||||||||||||
 Tier Initiation Decision–Begins Tier 2