How can school personnel intensify and individualize instruction?
Page 9: Making Instructional Decisions for Reading
 Recall from the Challenge that Natalia is a fourth-grade student who has serious reading problems, especially with decoding and fluency. She is currently reading at an early second-grade level. Natalia received targeted instruction:
- In a small group of 5 children
- In a heterogeneous group
- For 3 times per week
- For 20 minutes per session
- For 7 weeks
- Using a validated program that addressed phonological awareness, word study, and fluency skills
After seven weeks of targeted instruction, Natalia’s weekly progress monitoring data indicate that she is not making adequate progress. Consequently, the intervention team decides it is time to implement DBI.
Keep in Mind
Some of the information on this page mirrors that provided on the Making Data-Based Instructional Decisions for Reading page of the IRIS Module Intensive Intervention (Part 2): Collecting and Analyzing Data for Data-Based Individualization, which focuses on Steps 2, 3, and 5 of the DBI process.
Begin the DBI Process
Step 1: Validated Intervention Program
The intervention team at Natalia’s school decides to make quantitative changes to the validated program used during targeted instruction and to implement it for four weeks. The adapted intervention will be delivered:
- In a small group of 3 students
- In a homogenous group
- For 4 times per week
- For 30 minutes per session
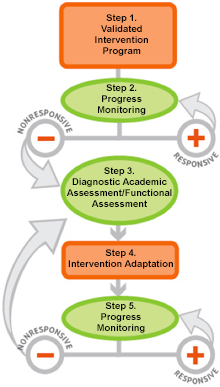
This graphic illustrates both the steps of data-based individualization, as well as they ways in which those steps interact. Step 1, “Validated Intervention Program,” is represented by an orange rectangle. This box connects via a vertical grey line to Step 2, “Progress Monitoring,” which is illustrated as a green oval. Both steps, in turn, are connected to a horizontal line with labeled circles at each of its ends. The circle on the left, “Nonresponsive,” has a red minus sign at its center, while the circle on the right, “Responsive,” has a red plus sign. A grey arrow connected to the “Nonresponsive” circle points toward Step 3 of the DBI process, “Diagnostic Academic Assessment/Functional Assessment,” which is represented as a green oval, similar to Step 2. The “Responsive” circle also has a grey arrow, this one pointing back up toward Step 2, “Progress Monitoring.”
Step 3 is connected via a vertical grey arrow to Step 4, “Intervention Adaptation,” represented as an orange rectangle. Another grey arrow connects Step 4 to Step 5, “Progress Monitoring,” another green oval. As above, these latter steps are connected to a horizontal line with labeled circles at each of its ends. The circle on the left, “Nonresponsive,” has a red minus sign at its center, while the circle on the right, “Responsive,” has a red plus sign. A large grey arrow connected to the “Nonresponsive” circle points back to Step 3, “Diagnostic Academic Assessment/Functional Assessment,” while the “Responsive” circle directs instructors back to Step 5, “Progress Monitoring.”
This module page focuses on Steps 1 and 4, so those orange boxes are highlighted whereas the rest of the graphic is slightly faded out.
Activity
Compare the instruction that Natalia received in targeted instruction to that she will receive once the DBI process begins. Discuss at least two ways in which the quantity of instruction will increase.
- More direct teacher instruction because of smaller group size
- Increased instructional time—Because Natalia will receive 1 extra session/week and the session length has been increased from 20 minutes to 30 minutes, the amount of instructional time Natalia will receive increases from 60 minutes to 120 minutes per week.
- More instruction in the skill that she struggles with because of homogenous grouping
Step 2: Progress Monitoring
After making these quantitative changes, Natalia’s teacher continues to monitor her progress (Step 2) for four weeks. Unfortunately, Natalia’s data indicate that she is still not making progress. Natalia seems to need additional intervention adaptations to support her learning needs.
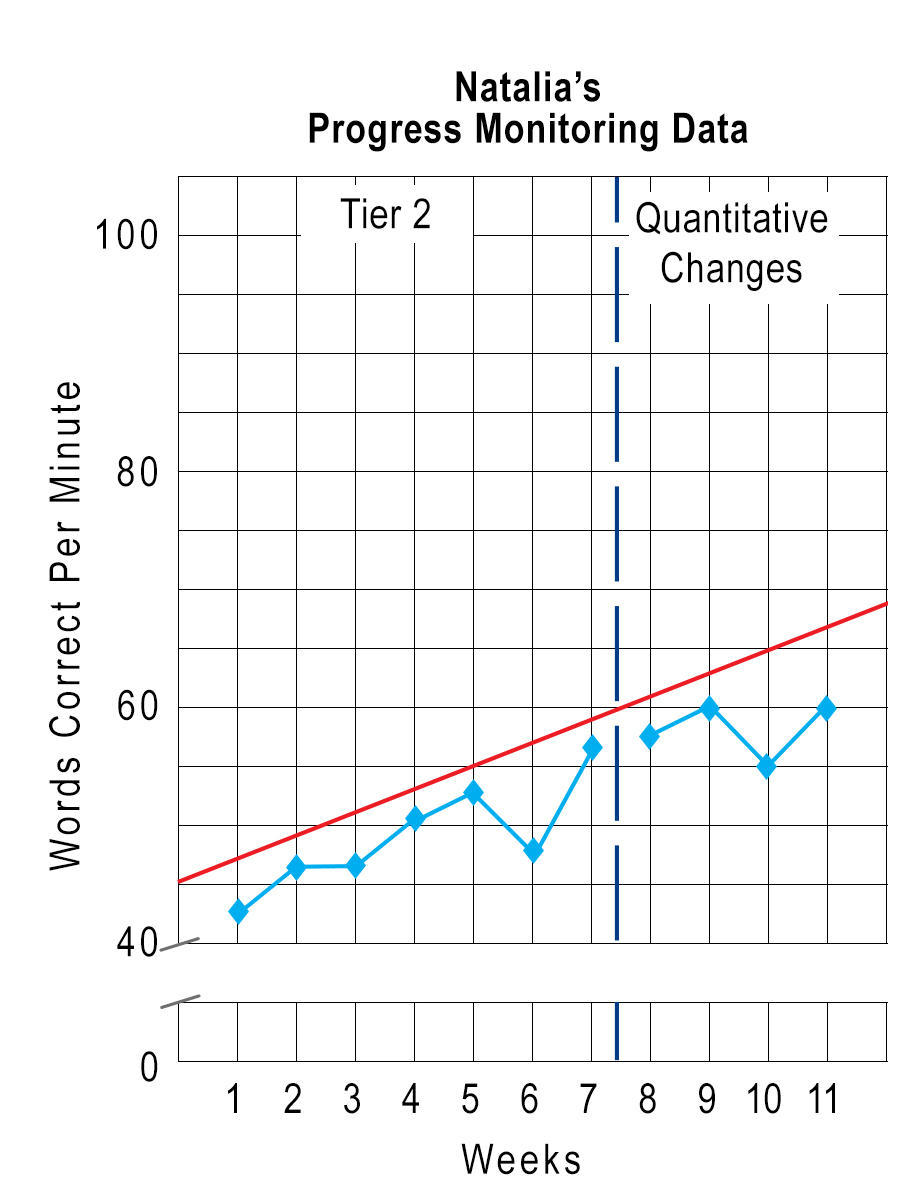
This graph displays Natalia’s progress monitoring data over a span of eleven weeks, which here form the x-axis and which is divided by a vertical blue dotted line after Week 7. The left side of this line is labeled “Tier 2,” whereas the section after the line is labeled “Quantitative Changes.” The y-axis is labeled “Words Correct Per Minute” and is divided into twenty word increments with a gap between 0 and 40 where there is no data.
Natalia’s goal line is represented by a red line that begins at 40 words per minute and ends just below 70 words per minute. Natalia’s actual correct words per minute are represented by a blue line that indicates the following numbers: just above 40 words per minute, just above 45 words per minute, just above 45 words per minute, 50 words per minute, just above 50 words per minute, just below 50 words per minute, just above 55 words per minute, just below 60 words per minute, 60 words per minute, 55 words per minute, and 60 words per minute. At all points, Natalia progress is beneath her goal line.
Keep in Mind
Steps 2, 3, and 5 related to data collection and analysis are explained in detail in the IRIS Module:
Step 3: Diagnostic Assessment
Because Natalia is not making progress, the teacher conducts an informal diagnostic assessment (e.g.,error analysis, phonics inventory). Informal diagnostic assessments help determine what specific skills the student is struggling with. The data from the diagnostic assessment show that Natalia is having difficulty applying decoding strategies to multisyllabic words.
error analysis
The process of reviewing error patterns in work samples or assessments (e.g., progress monitoring measure, phonics inventory) to identify a student’s skill deficits.
Step 4: Instructional Adaptation
Based on the informal diagnostic assessment results, Natalia’s intervention team believes that she may benefit from:
- Increased instruction from 30 to 45 minutes/session
- More explicit instruction
- More opportunities to practice
Activity
Review the three adaptations recommended for Natalia in Step 4.
- How much more instructional time will Natalia receive per week?
- Explain why Natalia will likely benefit from explicit instruction and more opportunities to practice.
- Natalia will receive an extra 15 minutes of instructional time per session, and she receives four sessions a week. This is a total of 60 extra minutes of instruction per week.
- By using explicit instruction, Natalia’s teacher can teach her how to decode multisyllabic words in a structured manner, as well as model this skill. The teacher can then guide Natalia through decoding multisyllabic words and provide corrective feedback. Because Natalia has severe and persistent learning difficulties, she will likely need 10–30 times more practice with a skill than her peers. Providing Natalia more opportunities to practice decoding multisyllabic words allows the teacher to give her more supervision and support. Additionally, opportunities to practice enable Natalia to become proficient with this skill and use it consistently.
Step 5: Progress Monitoring
Progress monitoring data were collected for six weeks. The data indicate that Natalia is making some progress, but not enough to meet her end-of-year goals. Because she has gone through the DBI process and not made adequate progress, the intervention team decide to repeat Steps 3–5.
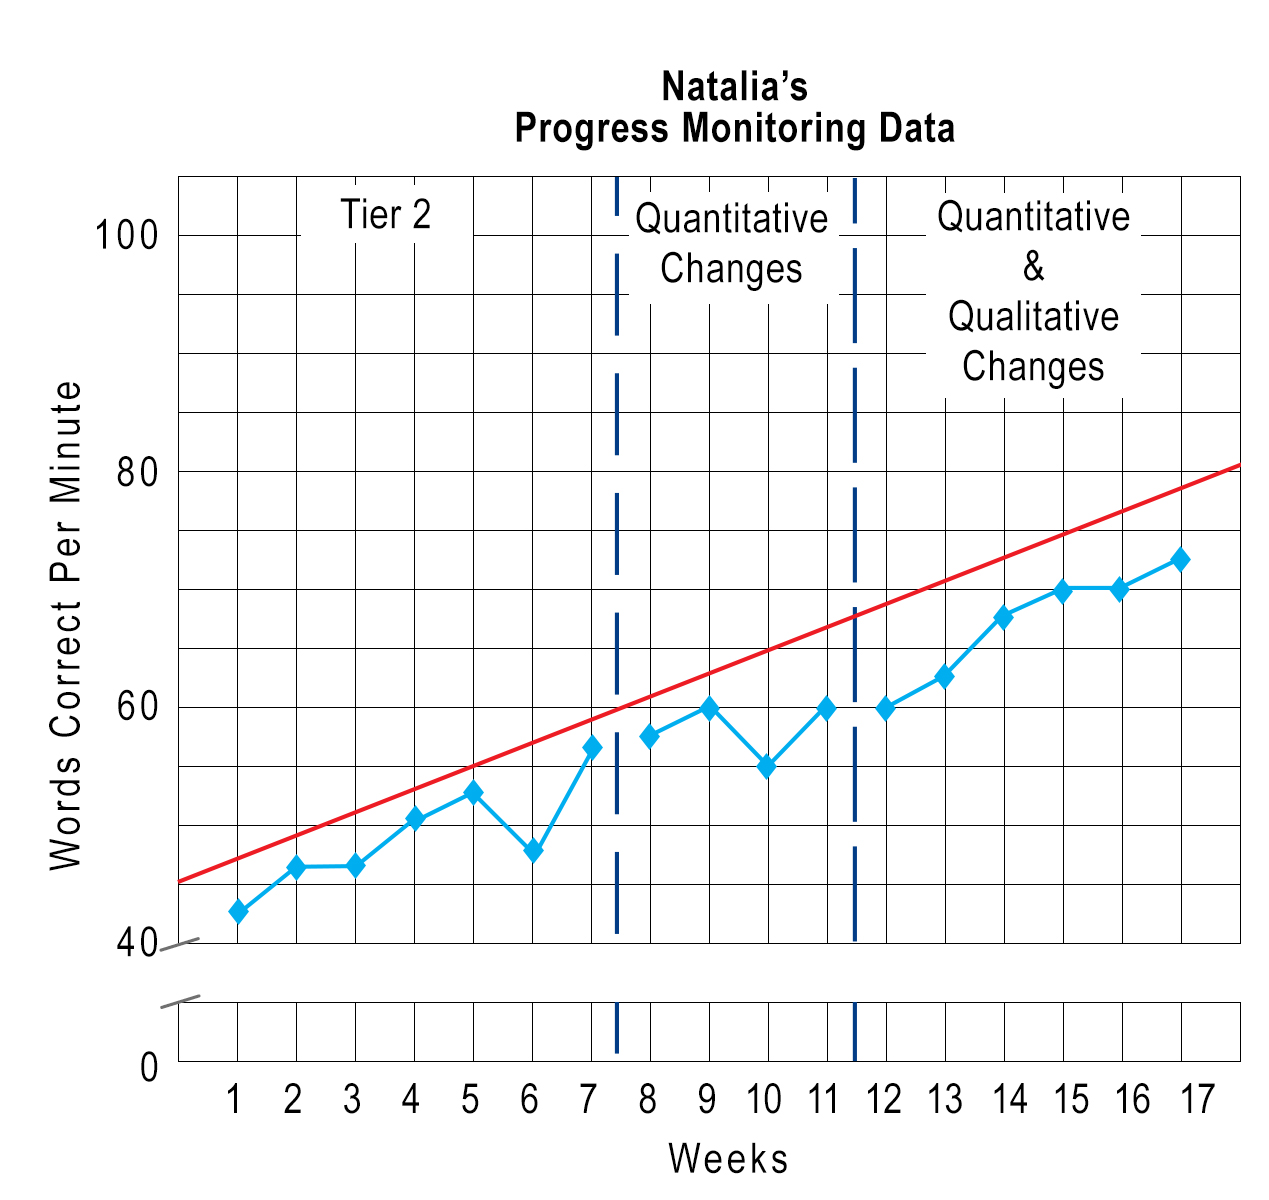
This graph displays Natalia’s progress monitoring data over a span of seventeen weeks, which here form the x-axis and which is divided by a vertical blue dotted line after Week 7. The left side of this line is labeled “Tier 2,” whereas the section after the line is labeled “Quantitative Changes.” At Week eleven and a half, another vertical dotted line divides the graph. From that point until Week 17, the graph is labeled “Quantitative and Qualitative Changes.”
The y-axis is labeled “Words Correct Per Minute” and is divided into twenty word increments with a gap between 0 and 40 where there is no data. Natalia’s goal line is represented by a red line that begins at 40 words per minute and ends at 75 words per minute.
Natalia’s actual correct words per minute are represented by a blue line that indicates the following numbers: just above 40 words per minute, just above 45 words per minute, just above 45 words per minute, 50 words per minute, just above 50 words per minute, just below 50 words per minute, just above 55 words per minute, just below 60 words per minute, 60 words per minute, 55 words per minute, 60 words per minute, 60 words per minute, just above 65 words per minute, just below 70 words per minute, 70 words per minute, 70 words per minute, and 75 words per minute. At all points, Natalia progress is beneath her goal line.
Keep in Mind
Recall that when working with students with severe and persistent learning difficulties, like Natalia, teachers might need to implement the last three steps of the DBI process (i.e., diagnostic assessment, intervention adaptation, progress monitoring) multiple times to reach the level of intensity and individualization required for the student to make adequate progress.
![]()
Let’s take a quick look at Natalia’s progress as Steps 3 through 5 of the DBI process are repeated.
Step 3: Diagnostic Assessment
The teacher conducts another informal diagnostic assessment. The resulting data indicate that Natalia is learning how to apply decoding strategies to multisyllabic words but that she fails to use the strategy consistently.
Step 4: Instructional Adaptation
Based on the informal diagnostic assessment results, the intervention team believes that in addition to the adaptations made earlier (i.e., 45 minutes/session, more-explicit instruction, more opportunities to practice), Natalia might benefit from self-regulation strategies.
Activity
The data indicate that Natalia is learning how to apply decoding strategies to multisyllabic words but that she fails to use the strategies consistently. The team decided that Natalia might benefit from self-regulation strategies. Which self-regulation strategy would you suggest the team choose? Justify your answer.
In this case, self-monitoring or self-instruction would be the best self-regulation strategies to help Natalia consistently apply decoding strategies. Self-monitoring would increase Natalia’s awareness of using the strategies consistently. Through self-instruction, Natalia can talk herself through the reading task using the decoding strategies (e.g., “Did I remember to use the decoding strategies?”).
Step 5: Progress Monitoring
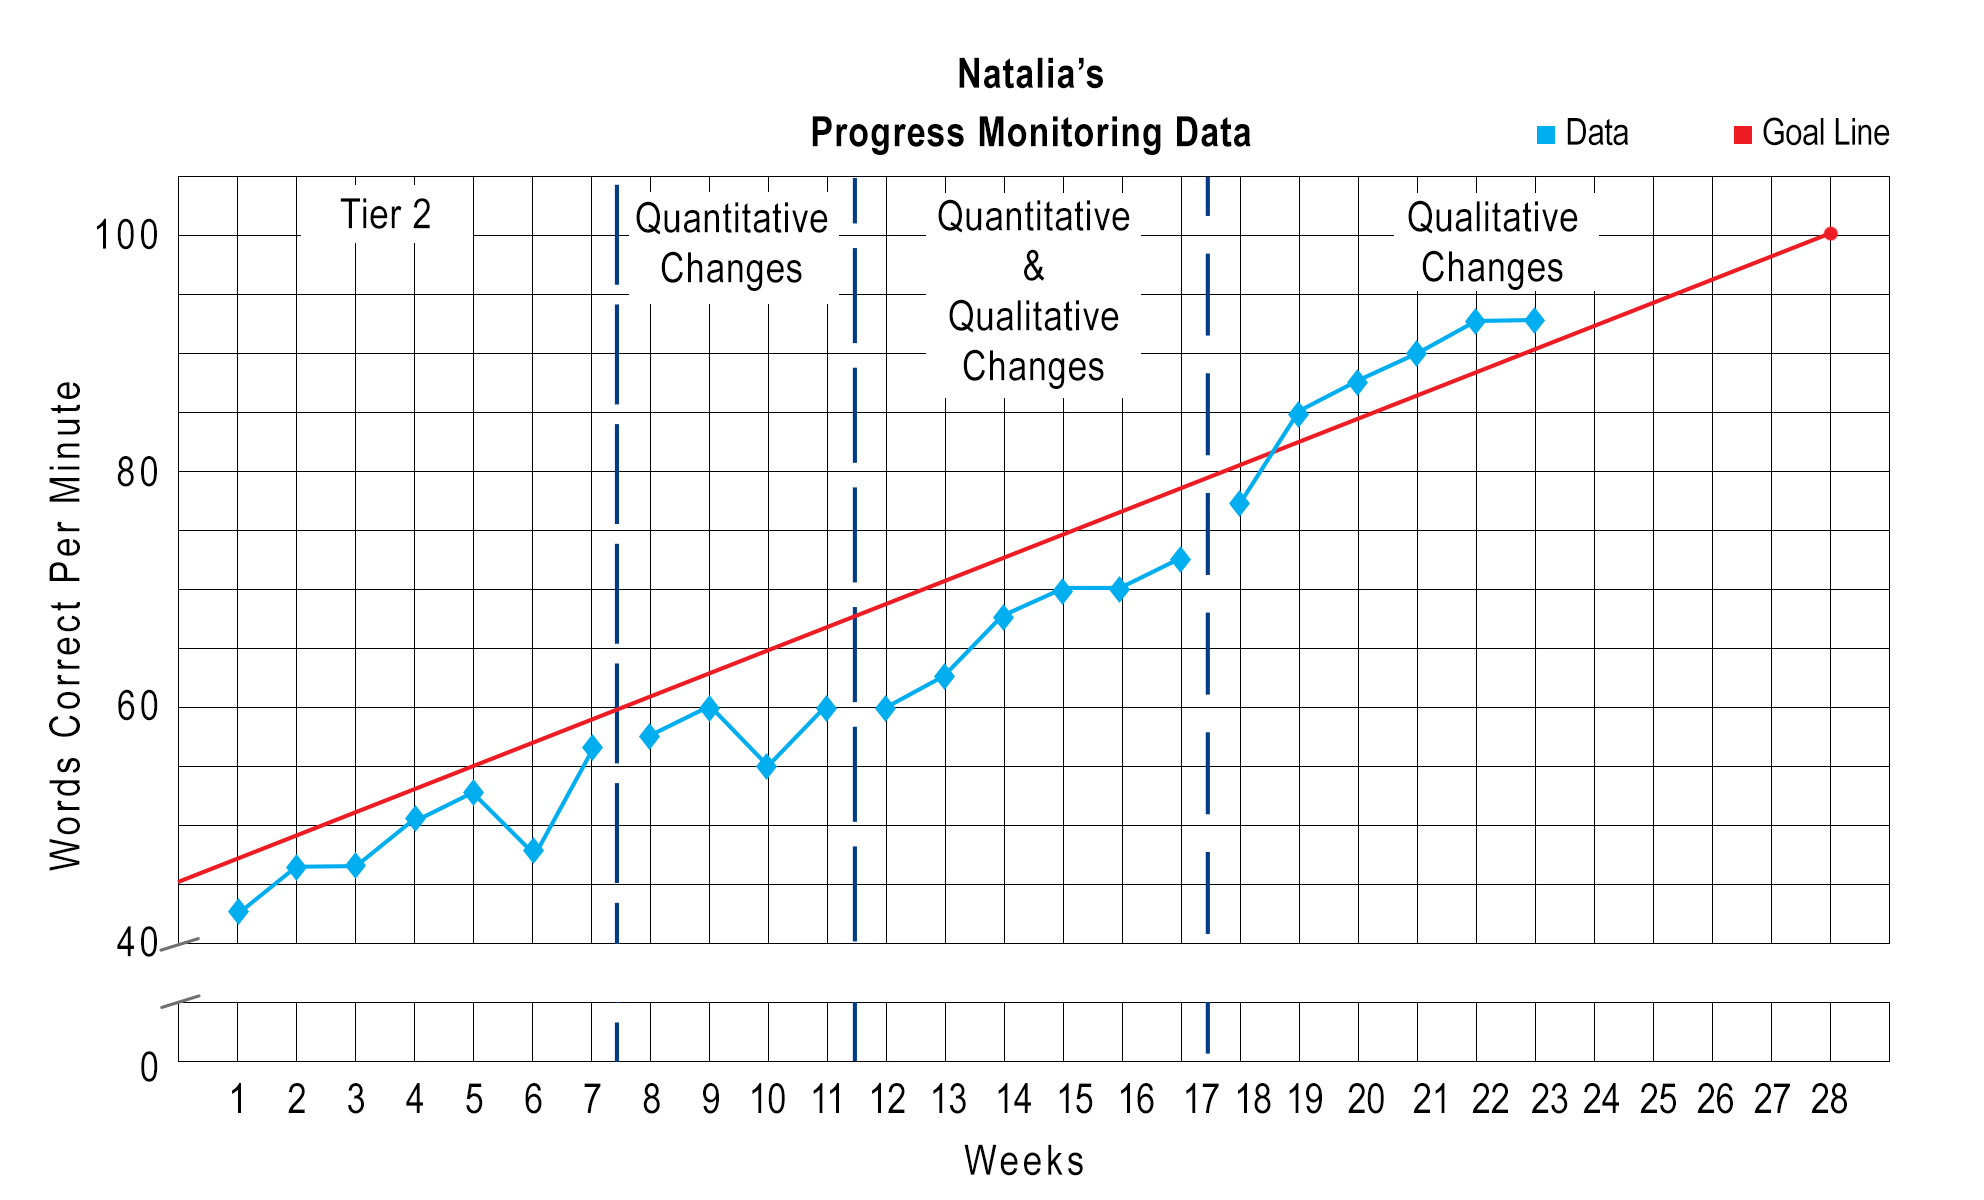
Progress monitoring data were collected for another six weeks. The data indicate that Natalia is making adequate progress. For this reason, the teacher will continue to implement these adaptations and monitor her progress.
Summary
By the end of the school year, Natalia is showing marked improvement in reading. Although the current interventions are effective for Natalia, the teacher must continue to collect progress monitoring data to assess her performance on an ongoing basis. An intervention that is effective now might not be what Natalia needs in the coming months. By collecting data, the teacher can make informed instructional decisions, something that will allow Natalia to experience continued success.