How do you measure infant, child, or student performance?
Page 3: Monitoring Progress
 Once you have identified a progress monitoring measure, you are ready to begin monitoring the progress of your children or students. This is a relatively simple process that offers a quick and accurate picture of their performance. The steps below describe how to monitor progress.
- Collect baseline data: Determine each individual’s current level of performance for the targeted skill (e.g., reading fluency, gross motor skills). Although you can estimate a child or student’s baseline from the score on one measure (or probe), you will get a better estimate of an individual’s level of performance by administering three probes within a week or so.
-
Identify the goal: Determine the level of performance that you want each child or student to reach by the end of the intervention or instructional period. This goal, or benchmark, is often indicated in the information that accompanies a progress monitoring measure (e.g., word identification fluency: the benchmark is 40 words correct per minute by the end of first grade).
xbenchmark
glossary
For Your Information
When setting a goal, especially for infants and toddlers, it is important to seek parent input. It is also important to get their thoughts about what should be done when their child is not on track to meet the goal.
- Create a graph: You can obtain progress monitoring graphs in two ways. Most commercially available progress monitoring measure come with graphing software. The second option is to create your own graphs. The horizontal axis represents the number of weeks of instruction. The vertical axis represents the range of possible scores a child or student can obtain on the probe. Once you have plotted each individual’s baseline data (i.e., three probe scores) on his or her graph, you can draw the goal line between the median of these scores and the goal.
x
goal line
glossary
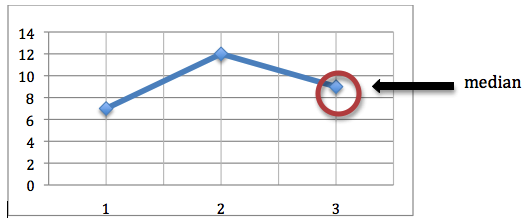
xmedian score
The middle value found by ordering scores from lowest to highest. For example, to determine the median of the numbers 7, 12, and 9, you would first put them in order (i.e., 7,9,12). The number in the middle (i.e., 9) is the median.
- Administer and score probes: You should administer and score the probes at regular intervals (e.g., weekly, bi-weekly). Some probes are individually administered, while others are administered to a group. In general, they can be administered in a few minutes. As the year progresses, young children or students should get more items correct on each subsequent probe. Click here to review a sample probe that has been scored.
- Graph scores: Every time a probe is administered, you will record this score on the graph and draw a line to connect each data point. Alternately, you can allow your students to graph their own data: Research shows that students who do so are more aware of their performance and view themselves as more responsible for their learning.
The figure below is an example of a student’s progress monitoring graph for reading fluency. Note that there is a vertical, dashed line separating the baseline data from the progress monitoring data. Also note that there is no line connecting the baseline data points to the progress monitoring data points.

To learn more about GOM, or CBM, including step-by-step procedures on how to identify measures, administer probes, score probes, and graph student data, view the IRIS Modules:
Listen as Jay Buzhardt describes the challenge of conducting authentic infant-toddler progress monitoring assessments (time: 1:10).

Jay Buzhardt, PhD
Associate Research Professor, Early Childhood Special Education
The University of Kansas<
Transcript: Jay Buzhardt, PhD
They can be administered quarterly for children that are at benchmark. For children that are performing below benchmark, we recommend, number one, starting some type of an intervention and then administrating the assessment more frequently. If you have an intervention in place then you want to be able to determine pretty quickly whether or not that intervention is making a difference, so we recommend at least monthly.
One of the big differences for infants and toddlers is that these are all services that are provided in the home, and so it makes it challenging to do assessments. Because, rather than being in a structured classroom where you have adequate resources, within a family’s home a lot times you don’t have the space or some of the resources that are available at a school to really do high-fidelity assessment. It makes infant and toddler assessments unique because they are designed to be done in an authentic situation, so that’s definitely a challenge for doing infant-toddler assessments.
Activity
Lucia is having difficulty with reading fluency. You have decided to monitor her progress for this skill and to graph her data. This includes plotting the baseline data, determining the median of the baseline scores, creating a goal line, and plotting progress monitoring data. Click here to begin this activity.