How do you know whether you are correctly implementing an EBP?
Page 7: Evaluating Fidelity of Implementation
After observational data have been collected, you can evaluate how well you are implementing the EBP. This simple four-step process involves calculating the percentage of steps or activities implemented correctly.
Example: PALS Observational Data
To calculate the teacher’s fidelity of implementation from the demonstration movie on the previous page, the observer completes the following steps. Click here to review the observational data form.
Step 1: 19 items on the form
Step 2: 10 items implemented correctly
Step 3: 10÷19= .526
Step 4: .526=53%
The teacher’s fidelity score is 53%.
Step 1. Determine the total number of items on the fidelity measure (excluding the quality items).
Step 2. Count the number of items you implemented correctly.
Step 3. Divide the number of items completed correctly by the total number of items.
Step 4. Change the decimal result in step three to a percentage.
The administration manual for a packaged practice or program might indicate the acceptable level of fidelity. If, however, this information is not available, a general rule of thumb is to aim for a minimum fidelity score of 60–80%.
Listen as Scott McConnell and Tom Kratochwill discuss considerations for determining an acceptable level of fidelity.

Scott McConnell, PhD
Professor, Educational Psychology
University of Minnesota
(time: 0:49)

Tom Kratochwill, PhD
Professor, Educational Psychology
Co-PI, Project PRIME
University of Wisconsin-Madison
(time: 1:48)
Transcript: Scott McConnell, PhD
What’s a good standard for fidelity? It depends on the thing being assessed. So in every intervention, there are some elements that are necessary and where our goal for fidelity is probably very close to a 100 percent. In other cases, other features of the intervention that are, frankly, less important for guaranteeing that outcome and where we can be a little bit more forgiving about fidelity. So I think that anyone monitoring the fidelity of an intervention needs to separate the things being observed into those necessary variables, where very high degrees of fidelity are essential, and those supportive variables that would help but where we can be a little bit more patient about their coming up to speed.
Transcript: Tom Kratochwill, PhD
There are two major issues to consider. The first is that there is actually no magic score that would give you a specific benchmark for whether the program is being implemented with fidelity. It is going to depend on the elements of the program and how the fidelity checklist has been created to model the critical elements of the program. Very often within programs, people would like to see 80 percent or higher of the elements of the program as a target. But that score can be somewhat arbitrary, depending on the way the checklist and components of the treatment program have been assessed or monitored by the investigator. A second consideration is that there may be core components of the program that are absolutely critical. So in a program where that element is part of the intervention, it would be absolutely critical that that part of the intervention be there. And so if it’s not, really one of the most important and critical features of the intervention would be missing. So if a teacher knows what the core and critical components of an intervention or an instructional program are, those would be the primary elements to focus on. That probably would yield then the need for having very close to a 100 percent of those core components present, and maybe some of the other more surface elements would not be as critical to include.
 If your fidelity score is below the criteria, you might need to review the manual or arrange ongoing support. Such support may be delivered through different types of training formats (e.g., coaching, mentoring, booster sessions, modeling) and by a number of individuals (e.g., school staff, external consultant). One of the most important components of ongoing support is corrective feedback, which has been shown to promote fidelity of implementation. Educators are more likely to maintain or improve their fidelity of implementation when they understand what elements they implemented correctly and which they need to improve. It is especially helpful to see the pattern of implementation across time. One way to do this is to record your performance for each of the implementation steps listed on the fidelity checklist across observations.
Types of training formats
coaching
A method of ongoing support in which an individual with experience or expertise, often of similar position, guides, instructs, and trains another person or group of people to develop specific skills.
mentoring
A method of ongoing support in which a more experienced or more knowledgeable person helps a less experienced or less knowledgeable person learn or refine skills.
booster session
A method of follow-up support in which a trainer provides an additional training session to do one or more of the following: review previously covered skills, present new skills, elaborate on and refine skills, and troubleshoot problems.
modeling
The act of providing an example as a means to encourage the imitation of a skill, process, characteristic, or style; the process whereby an educator observes a colleague as he or she provides instruction in order to see the process in action and to see its benefits firsthand.
corrective feedback
glossary
Not only is it helpful to know your overall fidelity score but it is also helpful to look more closely at your implementation of the individual steps or elements of a practice or program across time. When you examine the data more closely, one of two patterns often emerge:
- Varied pattern of implementation—inconsistent implementation of the steps where some days given steps are implemented well and other days they are not
- Consistent pattern of implementation—some are always implemented well while others are consistently implemented poorly
The tables below depict fidelity data for two educators across three observations. Notice that the fidelity scores for both educators range from 40%–60%. However, the pattern of data for each educator is different. Educator 1 shows a varied pattern of implementation. She is not implementing any step correctly over time. Educator 2 shows a consistent pattern of implementation. She implements Steps 1 and 4 correctly, but for the most part does not implement Steps 2, 3, and 5 correctly.
Educator 1: Varied Pattern of Implementation
| Observation 1 | Observation 2 | Observation 3 | |
| Step 1 | ✓ | ✓ | ✗ |
| Step 2 | ✓ | ✗ | ✗ |
| Step 3 | ✗ | ✓ | ✓ |
| Step 4 | ✗ | ✗ | ✓ |
| Step 5 | ✗ | ✓ | ✗ |
| Fidelity Score | 40% | 60% | 40% |
Educator 2: Consistent Pattern of Implementation
| Observation 1 | Observation 2 | Observation 3 | |
| Step 1 | ✓ | ✓ | ✓ |
| Step 2 | ✗ | ✗ | ✗ |
| Step 3 | ✗ | ✗ | ✗ |
| Step 4 | ✓ | ✓ | ✓ |
| Step 5 | ✗ | ✗ | ✓ |
| Fidelity Score | 40% | 40% | 60% |
Knowing the pattern of implementation helps you to understand which steps you are doing well and which you need to improve. This information can help you determine the type of support or training you need to seek.
After reviewing the manual or receiving support, you will need to be observed soon (e.g., a week later) to be sure that you are now implementing the EBP with fidelity. If you are still implementing the EBP with low fidelity, you may need to postpone implementation until you can participate in further training.
Listen as Lisa Sanetti discusses how training is important for maintaining high fidelity (time: 3:17).

Lisa Sanetti, PhD
Co-PI, Project PRIME
Associate Professor, Neag School of Education
University of Connecticut
Transcript: Lisa Sanetti, PhD
When teachers are first starting to implement an evidence-based practice, one of the things we find is that teachers have a lot of issues with doing it consistently across time. Often the fidelity rates are pretty high after initial training and then tend to sort of trail off across time. And there’s a lot of very valid reasons for this. We’re asking educators to do a lot of things at once. This is a new behavior, and implementing any new behavior is challenging. Add that with other competing demands for a teacher’s time and attention, and we can see why it can be a real challenge to implement an evidence-based practice with fidelity. We know that a lot of teachers will struggle. Not all teachers, but a lot of teachers will struggle and will need to go back and get some additional training or get some feedback on their implementation. A lot of times that can really help increase those fidelity levels across time. And we know that, with the right supports, that educators really can implement most evidence-based practices with fidelity. Sometimes it requires ongoing coaching. Sometimes it requires seeing somebody else do it in a classroom, having somebody model it for them. They’re a little unclear about what it really should look like. Sometimes it requires sitting down with another colleague and problem-solving how they can make this practice fit into their particular classroom so that it fits in with all the other competing demands that they have throughout the school day.
So one of the things that we know about learning to implement a new intervention and doing it correctly, is that training is essential. And we know that either professional development or other training opportunities that a teacher may have, they’re often sort of one-shot training. And, while that can provide a really great initial basis for an educator to implement a new practice, we know that that’s not going to be enough. I think it’s really important to recognize that most educators will need ongoing training or support to be able to implement more-challenging or complex interventions across time. That training can look really different. That training might be having ongoing meetings with or observations with a coach, an instructional coach, or a behavioral coach who’s really looking at implementation and giving some constructive feedback to help that educator implement the evidence-based practice so it’s most effective. It could be groups of teachers working with one another, to sort of check in on each other and see how they’re doing and problem-solve implementation. Sometimes if the teacher him or herself teaching themselves how to implement an intervention and really having to be good at self-evaluating how well they’re doing. We’ve worked with teachers who find a new intervention, figure out what those steps are that they need to do, and even just create a checklist and try to sort of self-monitor how well they were able to do that across time and slowly try to increase their implementation and their consistency across time.
Research Shows
Teachers who received corrective feedback demonstrated higher implementation fidelity compared to those teachers who did not. In addition, their students demonstrated more positive outcomes than students whose teachers did not receive feedback.
(Sanetti, Fallon, & Collier-Meek, 2013; Solomon, Klein, & Politylo, 2012)
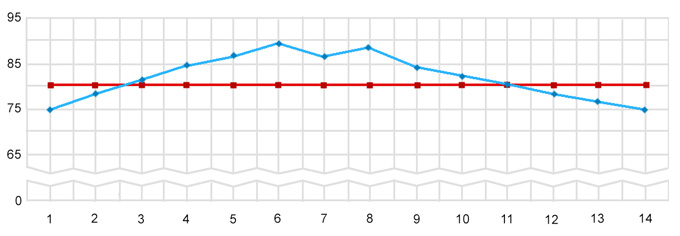
Remember, you will continue to monitor your fidelity of implementation even after you have achieved and maintained an acceptable level of fidelity. It is helpful to record your fidelity data on a graph so that you can look for patterns that indicate whether you are drifting—or straying from the correct procedures across time. For example, the graph below illustrates a teacher’s fidelity of implementation of an EBP across 14 weeks. For this EBP, the criterion for fidelity is 80%. Notice that the teacher achieves an acceptable level of fidelity in Week 3 and maintains fidelity through Week 11 although a downward trend begins in Week 6, most likely due to drift. Unfortunately, this trend continues and the teacher falls below the acceptable level of fidelity in Weeks 12–14. By reviewing these data, the teacher can easily see that she needs to improve fidelity of implementation.
Activity
Using the observational data you collected in the activity on page 6, calculate the middle school teacher’s fidelity (i.e., the percentage of steps he implemented correctly).
To calculate the teacher’s fidelity of implementation the Activity on page 6, the observer completes the following steps.
Step 1: 19 items on the form
Step 2: 13 items implemented correctly
Step 3: 13÷19= .684
Step 4: .684=68%
The teacher’s fidelity score is 68%.