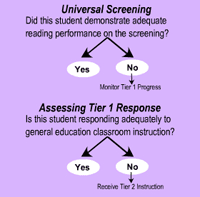
How will teachers initially identify struggling readers?
Page 6: Identifying Students Who Do Not Show Adequate Progress in Tier 1
Click on the movie to see how Mrs. Hernandez evaluates the progress of the struggling readers in Tier 1 (time: 1:22).
Transcript: Mrs. Hernandez Evaluates Progress in Tier 1
Let’s review Mrs. Hernandez’s implementation of the RTI approach up to this point. First, Mrs. Hernandez administered the universal screening measure and identified the struggling readers in her class. She continued to provide high-quality reading instruction to all students in her classroom using the curriculum selected by the district. Although the Rosa Parks S-Team decided that she only had to monitor the progress of the struggling students, Mrs. Hernandez decided to monitor the progress of all her students once a week using the Vanderbilt University Word Identification Fluency measure. She decided to do this because she wanted to compare the progress of her struggling students with that of her non-struggling students to make certain that she was indeed providing high-quality instruction to her entire class. She also wanted to use this data to inform her instruction. In addition, she also knew from past experience that implementing progress monitoring with all students and allowing them to graph their own data would motivate students to succeed. This past summer, Mrs. Hernandez received RTI training that included information on how to use each student’s rate of growth to evaluate his or her progress. After eight weeks, she is now ready to apply this knowledge to determine who is benefiting from instruction in Tier 1 and who needs intervention.
The S-Team members at Rosa Parks Elementary previously decided that the teachers would use rate of growth to evaluate how students respond to Tier 1 instruction. After eight weeks of Tier 1 instruction and weekly progress monitoring, Mrs. Hernandez is ready to evaluate who is benefiting from the high-quality general education classroom instruction and who needs more intensive intervention. To do so, Mrs. Hernandez examines the CBM data collected for the five struggling readers for the past eight weeks. She begins with DeJuan.
Note: Even though the teachers at Rosa Parks will be evaluating student performance using rate of growth, this page describes both methods of evaluating student performance.
Rate of Growth
Determine DeJuan’s Slope
Mrs. Hernandez uses the Vanderbilt University WIF probe to conduct progress monitoring. The rate of growth established for this probe is 1.8 or higher. This information was included with the probe materials and has been established through research. Mrs. Hernandez gathered the following information regarding DeJuan’s performance on the WIF probes during the past eight weeks.
DeJuan
The score on the first probe: 8
The score on the last probe: 10
The first administration time period: week 1
The last administration time period: week 8
Slope = click to calculate DeJuan’s slope and to see if it agrees with Mrs. Hernandez’s calculation.
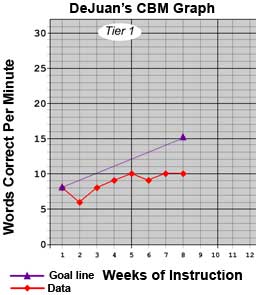
Mrs. Hernandez determines that DeJuan’s rate of growth, or the slope of his CBM scores, is .29.
DeJuan
The score on the first probe: 8
The score on the last probe: 10
The first administration time period: week 1
The last administration time period: week 8
| Step 1 | Collect the following:
|
DeJuan’s Information
|
||||||||
| Step 2 | Apply the following formula:
|
|
DeJuan’s rate of growth (the slope of his scores) is relatively flat and shows that he is not making adequate weekly progress.
Evaluate DeJuan’s Rate of Growth
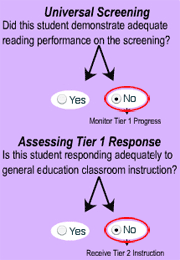
DeJuan’s rate of growth (the slope of his scores) is .29, which is below the Vanderbilt University WIF criterion of 1.8. (Note that in DeJuan’s graph [above] the pattern of his graphed CBM scores is relatively flat.) That DeJuan’s slope is less than the specified rate of growth indicates that he is not making adequate progress and would benefit from Tier 2 intervention.
Performance Level
Note: Even though the teachers at Rosa Parks are not using performance level to evaluate student progress, the section below is provided in order to illustrate how to use this method.
Identify DeJuan’s Expected Performance Level
In order to evaluate DeJuan’s performance level, Mrs. Hernandez looks up the beginning-of-year benchmark for the WIF, which is 15 words correctly per minute. That is, at the end of eight weeks of Tier 1 instruction, DeJuan should be reading 15 words correctly per minute on the WIF probes.
 To determine the short-term goal, Mrs. Hernandez will need to know the following pieces of information:
- The End-of-year benchmark
- The Student’s average CBM score on the first three probes
- The Number of weeks left in the school year
- The Number of weeks of monitoring
| DeJuan |
| Step 1: |
| 30 – 8 = 22 |
| Step 2: |
| 26 weeks left in school year |
| Step 3: |
| 22 ÷ 26 = .85 |
| Step 4: |
| .85 × 8 = 6.8 |
| Step 5: |
| 6.8 + 8 = 14.8 |
| DeJuan’s short-term goal is 15 wcpm. |
| Calculation Directions | Rosa Parks’s Example | |
| Step 1 | Determine the minimum number of words that the student needs to gain across the year. Start with the end-of-year benchmark for a given grade level. Subtract the student’s score on the average of the first three CBM probes. | The benchmark Rosa Parks Elementary School is using for first grade is 30 words correct per minute (wcpm). DeJuan’s score was 8 wcpm.
30 – 8 = 22
The minimum number of words that DeJuan needs to gain across the year is 22 wcpm. |
| Step 2 | Determine the number of weeks left in the school year. | Mrs. Hernandez determines that there are 26 weeks left in the school year. |
| Step 3 | Determine the minimum number of words that the student needs to achieve in order to meet the end-of-year benchmark. Take the minimum number of words that the student needs to gain across the year and divide it by the number of weeks left in the school year. | Divide the minimum number of words that DeJuan needs to gain across the year (22 wcpm) by the number of weeks left in the school year (26).
22 ÷ 26 = .85
In order to reach the end-of-year benchmark, DeJuan needs to be able to read, on average, an additional word each week. |
| Step 4 | Determine the short-term gain. Multiply the weekly gain by the number of weeks. This process indicates the number of words the student needs to gain. | Mrs. Hernandez wants to know how many words DeJuan needs to be reading at the end of the eight-week monitoring period. She multiplies the weekly gain (.85) by the number of weeks (8). This indicates the number of words he needs to gain.
.85 x 8 = 6.8
|
| Step 5 | Determine the short-term goal. Add the short-term gain to the student’s initial score. | Add the short-term gain (6.8 wcpm) to DeJuan’s initial score (8 wcpm).
6.8 + 8 = 14.8
At the end of eight weeks of progress monitoring, DeJuan should be reading 15 wcpm. |
Note: See the Teacher’s Materials Center for a Short-Term Goal Calculator .
Evaluate DeJuan’s Performance Level
At the end of the Tier 1 monitoring period, Mrs. Hernandez computes the average of DeJuan’s last three CBM scores (i.e., 9, 10, and 10) in order to calculate his performance level. He has been reading, on average, 10 words correctly per minute on his three most recent CBM probes. Because the benchmark is 15 and DeJuan’s performance level is 10, he has not met the benchmark, indicating that he is not making adequate progress and would benefit from Tier 2 intervention.
Let’s Review DeJuan’s Tier 1 Performance
 Each of the evaluation methods above (i.e., rate of growth, performance level) illustrates that DeJuan is not responding adequately to Tier 1 instruction. Mrs. Hernandez decides that DeJuan might benefit from more intensive instruction (i.e., Tier 2).
Performance Results for the Other Students
Next, Mrs. Hernandez evaluates the performance levels and rates of growth for Megan and Jack.
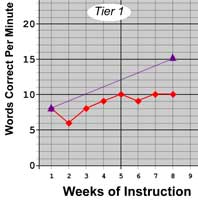
Megan

Megan’s Tier 1 progress monitoring data are in the graph to the right.
The first thing Mrs. Hernandez does is to calculate Megan’s slope using the following formula:
| Slope = | 18-5 8-1 |
= | 13 7 |
= | 1.86 |
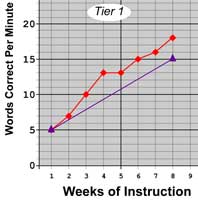
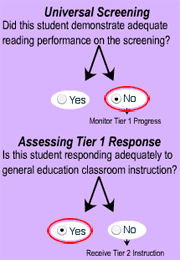
Megan’s rate of growth, or slope, is greater than the WIF criterion of 1.8. She is making adequate progress with the high-quality instruction she receives in Tier 1. Although Mrs. Hernandez will continue to keep an eye on Megan’s progress, to make certain that she continues to learn at an adequate rate, no further tier decision is necessary at this time.
Jack

Jack’s Tier 1 progress monitoring data are in the graph to the right.
Mrs. Hernandez first calculates his slope:
| Slope = | 8-2 8-1 |
= | 6 7 |
= | 0.86 |
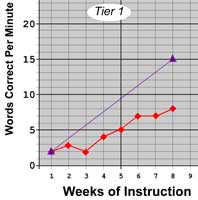
Jack’s rate of growth, or slope, is less than the WIF criterion of 1.8. He is not making adequate progress with the high-quality instruction he is receiving in Tier 1. Mrs. Hernandez decides that Jack would benefit from the additional targeted intervention provided in Tier 2.
The table below summarizes the progress monitoring assessment data and the RTI Tier 1 decision for DeJuan, Megan, and Jack.
| Student | Data | Decision Process | RTI Tier 1 Decision |
 |
 |
 |
|
|
|
 |
|
|
|
|
|
Activity
The final two struggling readers in Mrs. Hernandez’s class are Ryan and LaToya. Help Mrs. Hernandez to evaluate their performance level and rate of growth and make placement decisions based on that data. Click each picture below to begin this activity.


Mrs. Hernandez has made decisions regarding instructional intensity for each of the students not responding adequately to Tier 1 instruction. Now proceed to the following page to find out what happens to those students (DeJuan, Jack, LaToya, and Ryan) who receive Tier 2 intervention.