Do perceptions matter?
Page 5: Facts and Figures
According to the U.S. Census Bureau, in 2014, 27.2 percent of people living in the United States—85.3 million individuals—had a disability. As such, most of us come across individuals with some type of disability in our daily lives, at school, at work, or in the greater community.
Activity
We often go about our daily routines without giving a second thought to the people around us. How do you perceive individuals with disabilities compared to those without disabilities? Take a moment to reflect and then write down your perceptions regarding each of the following areas:
- Employment: Rate of absenteeism at work
- Income: Annual earnings
- Education: Likelihood of attaining a bachelor’s degree or higher
- Social and Community Engagement: Percent who are married
Now that you’ve completed the Activity, let’s examine some facts and figures regarding individuals with disabilities in three areas: employment, education, and social and community engagement. As you do so, think about whether they align with your perceptions.
Employment
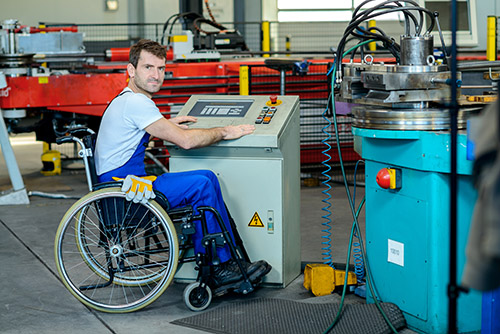 In large part because of the Americans with Disabilities Act and the efforts of disability rights advocates, millions of people with disabilities lead active work lives, holding a wide range of jobs that includes everything from machine operators, administrative assistants, and service workers to nurses, lawyers, and engineers. For more information, see the table below.
-
According to a 2018 report from the U.S. Bureau of Labor Statistics, 30.4% of adults with disabilities ages 16 to 64 were employed, compared to 74% of adults without disabilities. Clearly, there is still plenty of room for improvement. However, a closer examination of the data shows us that the percentages of people with and without disabilities in the major occupational areas are markedly similar. In other words, people with disabilities are employed in the same types of jobs as those without disabilities, though not at a rate that is equitable to those without disabilities.
Occupation Persons With a Disability Persons Without a Disability Management, professional, and related occupations 33.7% 40.3% Service occupations 19% 23% Sales occupations 23.1% 21.4% Natural resource, construction, and maintenance occupations 10.3% 9.3% Production, transportation, and material moving occupations 13.9% 11.8% Source: U.S. Bureau of Labor Statistics (2019)
- The employment barrier is further reduced by the increasing availability of reasonably priced accommodations (e.g., a sit/stand workstation). In a report by the Job Accommodation Network (2018):
- 59% of employers reported that they were able to provide accommodations for individuals with disabilities with no expenditures (e.g., by allowing the individual to bring a service animal to work).
- 36% reported that they had a one-time cost, the median amount of which was $500.
- In today’s world, it is easier than ever to ensure that the work environment is accessible for everyone, including individuals with disabilities. To do so, the employer should provide:
- Accessible technology — technology that is beneficial for those with and without disabilities (e.g., a smart phone with built-in speech-to-text capabilities)
- Assistive technology — any device or service that is used to increase, maintain, or improve the functional capabilities of an individual with a disability (e.g., screen reader software for a computer)
speech-to-text
glossary
screen reader software
glossary
When these technologies are available, people with disabilities are more likely to be hired, perform their duties successfully, and advance within their chosen career.
Education
An individual’s level of education or training can affect her available employment opportunities.
- According to the U.S. Department of Education, in the 2015–2016 school year almost 70% of students with disabilities graduated from high school with a regular diploma. This is a substantial improvement over the 27% that received regular diplomas approximately 20 years earlier.
- In a longitudinal study funded by the U.S. Department of Education, 60% of young adults with disabilities reported that they pursued further education within eight years of exiting high school. More specifically, they enrolled in:
- Two-year or community college (44%)
- Vocational, business, or technical school (32%)
- Four-year college or university (19%)
- Most college campuses are generally accessible and maintain an office specifically for disability services and support. However, only 19% of young adults with disabilities in the aforementioned longitudinal study reported requesting and receiving accommodations in these post-secondary settings. By comparison, of these same young adults, 87% reported receiving accommodations and supports during their time in high school.
Social and Community Engagement
Living more independently is a goal for many students as they make the transition from high school to post-school programs or environments. Two important aspects of adult success are being self-sufficient and engaging in social and community activities.
- In a longitudinal study funded by the U.S. Department of Education, within eight years of leaving high school young adults with disabilities reported that they:
- Engaged with friends outside of organized activities at least once per week (77%)
- Lived independently (on their own or with a spouse, partner, or roommate) (59%)
- Had driving privileges (78%)
- Were registered to vote (71%)
- Participated in lessons or classes outside of school, volunteer or community service activities, or organized school or community groups (52%)
- Thanks to the work of disability advocates, many organizations exist to help people with disabilities engage in recreational activities. For example, Achilles International provides opportunities for individuals with all types of disabilities to participate in local and national running events.
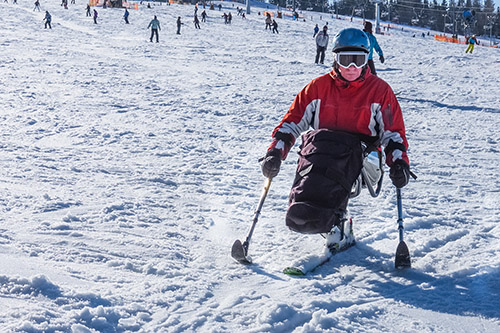 Technological advances allow more access to leisure activities than ever before. The picture to the right shows specially designed skiing equipment for people who use wheelchairs.
- Increased public awareness has resulted in the development of accessible resorts, national park trails, playgrounds, and cruise ships. For example, Morgan’s Wonderland is an inclusive theme park built for the enjoyment of people of all ages and abilties.
Activity
As you just learned, many individuals with disabilities lead active work lives, pursue further education, and are actively engaged in the community. Now that you have reviewed the facts and figures above, revisit your perceptions regarding the three points in the Activity at the top of the page. For each point, reflect on your initial perceptions and revise if necessary. Once you’ve done so, compare your thoughts to the additional facts for each.
Industry reports, such as those released by Dupont, indicate that employees with disabilities and those without disabilities have the same rates of absenteeism.
According to the Institute on Disability’s 2018 Annual Report on People with Disabilities in America, the median income of full-time employees with disabilities was $40,353 as compared to $45,449 for those without disabilities.
According to the Institute on Disability’s 2018 Annual Report on People with Disabilities in America, 14.3% of people with disabilities ages 25-34 attained a bachelor’s degree or higher while 37.2% of those without disabilities did so. Clearly, there is still a large gap. However, the federal government and individual states are taking measures to close this gap.
According to the Institute on Disability’s 2018 Annual Report on People with Disabilities in America, approximately 63.1% of people with disabilities (ages 18–64) have been married while 63.5% of those without disabilities have been.