Please ensure Javascript is enabled for purposes of website accessibility Assessment
  • IRIS Center
  • Resources
    • IRIS Resource Locator
      Modules, case studies, activities, & more
    • Evidence-Based Practice Summaries
      Research annotations
    • High-Leverage Practices
      IRIS resources on HLPs
    • Films
      Portrayals of people with disabilities
    • Children's Books
      Portrayals of people with disabilities
    • Glossary
      Disability related terms
    • For PD Providers
      Sample PD activities, planning forms, & more
    • For Faculty
      Top tips, coursework planning, & more
    • Website Navigation Videos
      Getting around our Website & modules
    • New & Coming Soon
      Latest modules & resources
    • IRIS Archived Resources
      Modules, alignment tools, & more
  • PD Options
    • PD Certificates for Educators
      Our certificate, your PD hours
    • Log in to Your IRIS PD
    • For PD Providers
      Sample PD activities, planning forms, & more
    • IRIS+ School & District Platform
      A powerful tool for school leaders
  • Articles & Reports
    • Articles
      Articles about IRIS use & efficacy
    • Internal IRIS Reports
      Reports on IRIS use & accomplishments
    • External Evaluation Reports
      Evaluations of the IRIS Center
    • IRIS Stories
      Our resources, your stories
    • News & Events
      What, when, & where it's happening
  • Help
    • Help & Support
      Get the full benefit from our resources
    • Website Navigation Videos
      Getting around our Website & modules
  • Progress Monitoring: Mathematics
Challenge
Initial Thoughts
Perspectives & Resources

How can teachers use assessment to guide instruction?

  • 1: Formative Assessment
  • 2: Progress Monitoring

How can teachers determine whether students are making appropriate progress?

  • 3: Select a Measure
  • 4: Create a Graph
  • 5: Create a Goal Line
  • 6: Administer, Score, and Graph
  • 7: Make Data-Based Instructional Decisions
  • 8: Communicate Progress

Resources

  • 9: References, Additional Resources, and Credits
Wrap Up
Assessment
Provide Feedback

Progress Monitoring: Mathematics

Assessment

Take some time now to answer the following questions. Please note that the IRIS Center does not collect your Assessment responses. If this is a course assignment, you should turn them in to your professor using whatever method he or she requires. If you have trouble answering any of the questions, go back and review the Perspectives & Resources pages in this module.

  1. Name at least three benefits of formative assessment.
  2. Describe how GOM allows an educator to track a student’s growth in all skills across the entire academic year.
  3. Briefly describe the GOM process, making sure to include each step.
  4. Mr. Alexander, a sixth-grade mathematics teacher, is monitoring Imani’s progress using a commercially available GOM computation probe. Note: Although it would be more common to score by problems correct, in this example, Mr. Alexander scores using digits correct.
    1. Score Imani’s Week 7 probe by digits correct. Mr. Alexander denoted incorrect digits with a red slash. To help you determine Imani’s score, you can place a green dot below each correct digit.
      Computation probe

      Review Description

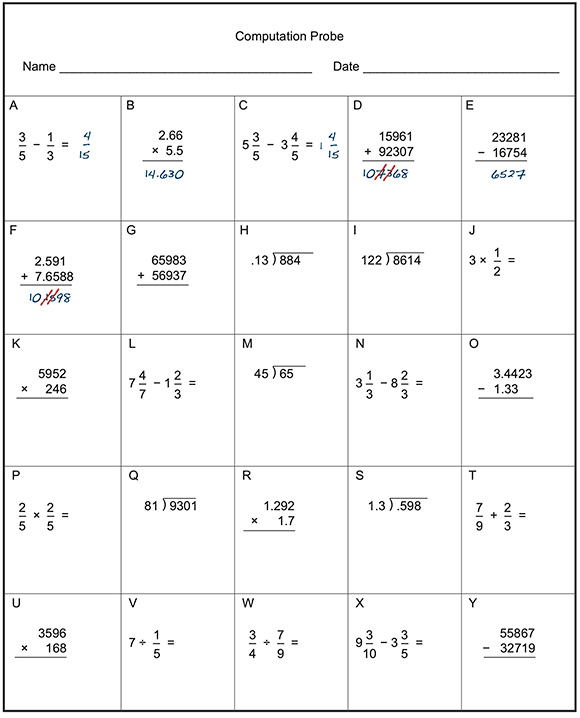
      Imani’s computation probe is a single sheet consisting of 25 mathematics problems. Labeled “Computation Probe” at the top of the sheet, there are places for the student’s name and the date of administration. The lettered items represent a variety of mathematics problems, including addition and subtraction with both whole numbers and fractions, division, and multiplication. Imani has completed the first six items. Her answers are 4/15, 14.630, 1 4/5, 107368, 6527, and 10.1598. Mr. Alexander has marked the digits 7 and 3 incorrect in Imani’s fourth answer and the second 1 and 5 in her sixth response. He noted these errors by making a red slash mark through each digit. The rest of the digits are correct.

    2. Graph Imani’s data for Weeks 2–7. The data were collected on Tuesday and, therefore, should be graphed accordingly. Note: The data for Week 7 is the score obtained in 4a.
      • Week 2=18
      • Week 3=20
      • Week 4=20
      • Week 5=21
      • Week 6=22
      • Week 7=?
    3. Describe what Imani’s data indicate and the resulting instructional decision that Mr. Alexander should make.
    4. List two talking points that you would note in a meeting with Imani’s parents regarding her performance.

Click here to open Imani’s graph for printing.

Print Friendly, PDF & Email
Back
Congratulations, you have completed this module!
 Provide Feedback
Join Our E-Newsletter Sign Up
  • Home
  • About IRIS
  • Sitemap
  • Web Accessibility
  • Glossary
  • Terms of Use
  • Careers at IRIS
  • Contact Us
Join Our E-Newsletter Sign Up

The IRIS Center Peabody College Vanderbilt University Nashville, TN 37203 [email protected]. The IRIS Center is funded through a cooperative agreement with the U.S. Department of Education, Office of Special Education Programs (OSEP) Grant #H325E220001. The contents of this website do not necessarily represent the policy of the U.S. Department of Education, and you should not assume endorsement by the Federal Government. Project Officer, Anna Macedonia.

Copyright 2025 Vanderbilt University. All rights reserved.

* For refund and privacy policy information visit our Help & Support page.

Creative Commons License This work is licensed under a Creative Commons Attribution-NonCommercial-NoDerivatives 4.0 International License.

  • Vanderbilt Peabody College
We use cookies to ensure that we give you the best experience on our website. If you continue to use this site we will assume that you are happy with it.Ok