How can teachers determine whether students are making appropriate progress?
Page 5: Create a Goal Line
 To more quickly evaluate a student’s performance over time, the educator will find it helpful to add a goal line to the student’s graph. The goal line represents the progress a student is expected to make throughout the year. It is simply a line on the graph that connects an individual student’s baseline performance and the expected mid-year or end-of-year performance goal. Below are step-by-step instructions for creating a goal line, followed by an example.
Note: For illustrative purposes, many graphs in this module depict 10 weeks of instruction. Ideally, data should be collected for a longer period to monitor progress toward a long-term goal.
Establish a Baseline: To create a goal line for each student, first determine each student’s baseline—or current level of performance. A stable, clear baseline can usually be established with three to five data points collected over a short span (e.g., one week). To denote the shift from baseline data to an instructional change or intervention, draw a solid vertical line after the last baseline data point—between the x-axis on which the last baseline data point is plotted and the next x-axis on the graph. Next, identify the median score—the score that falls in the middle when scores are ordered from lowest to highest—of the baseline data points. Finally, plot the median baseline data point on the graph by placing an “X” at the intersection of this new line and the median baseline data score.
Determine the Expected Goal: After establishing the baseline, determine and plot the expected goal and denote with a “G”. When doing so, it’s important to set ambitious long-term goals for students. Most commercially available GOM measures include mid-year and end-of-year (EOY) performance benchmarks or goals that are based on national norms. These can be used for typically developing and at-risk students. For example, the benchmarks below are for the Vanderbilt Computation and Concepts and Applications measures.
| Vanderbilt Progress Monitoring Measures End-of-Year Performance Benchmarks |
||
|---|---|---|
| Grade | Computation | Concepts and Applications |
| Kindergarten | N/A | N/A |
| 1 | 20 digits | 20 points |
| 2 | 20 digits | 20 points |
| 3 | 30 digits | 30 points |
| 4 | 40 digits | 30 points |
| 5 | 30 digits | 15 points |
| 6 | 35 digits | 15 points |
Draw the Goal Line: Now that the student’s baseline and goal have been plotted, the next step is to create a goal line by drawing a dashed line between these two points. This line represents the slope—or the student’s expected rate of improvement (ROI) needed to meet their end-of-year goal. For example, an ROI of 3 means that the student would need to correctly solve three additional problems correctly per week to stay on track to meet the goal (e.g., mid-year, end-of-year). Just as students’ median baseline data points will vary, so too will the goal line.
Note: Most commercially available GOM measures include the ROI.
rate of improvement
glossary
Example: Now let’s look at an example of how to create a goal line.
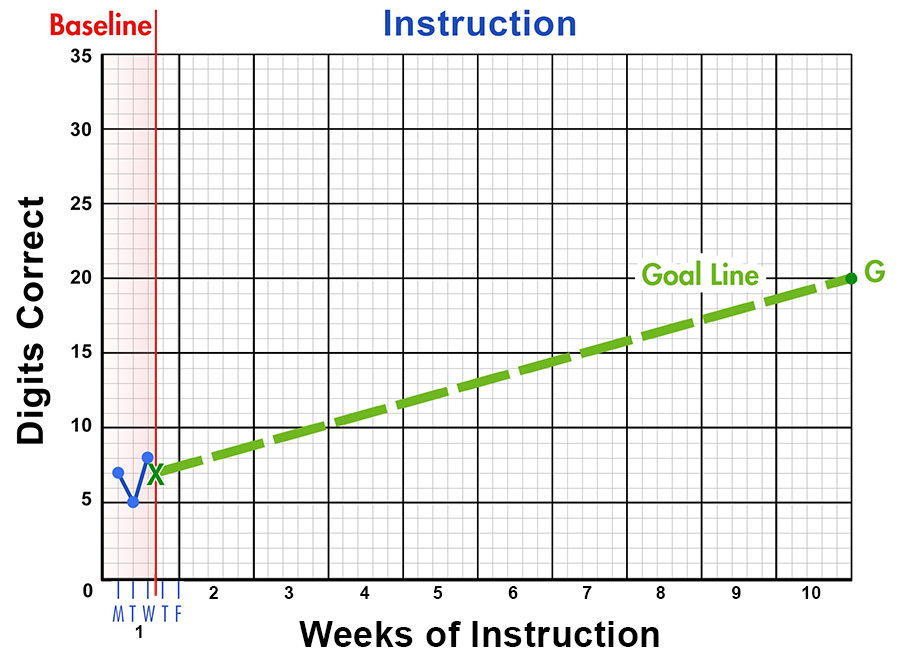
Step 1: Establish a baseline—A teacher collects and plots baseline data for a student across three consecutive days and draws a vertical line on the graph to denote the end of baseline data collection (see red line on graph below). The student receives scores of 7, 5, and 8. To determine the median, the teacher orders the scores from lowest to highest and then identifies the middle score: 5 7 8. Next, she plots the median baseline score on the solid vertical line (denoted by the green X on the graph below).
Step 2: Determine the expected goal—Using the Vanderbilt Progress Monitoring Measures end-of-year performance benchmark, the teacher determines that the end-of-year goal is 40 digits correct. She plots this on the graph and denotes it with a “G.” Note: For illustrative purposes, this graph reflects a ten-week goal, which has been plotted at the end of Week 10.
Step 3: Draw the goal line—The teacher draws a goal line connecting the students median baseline data point and the expected goal (see green dashed line on the graph below).
For Your Information
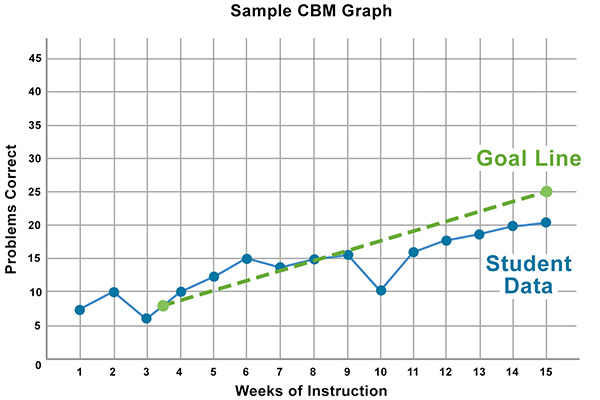
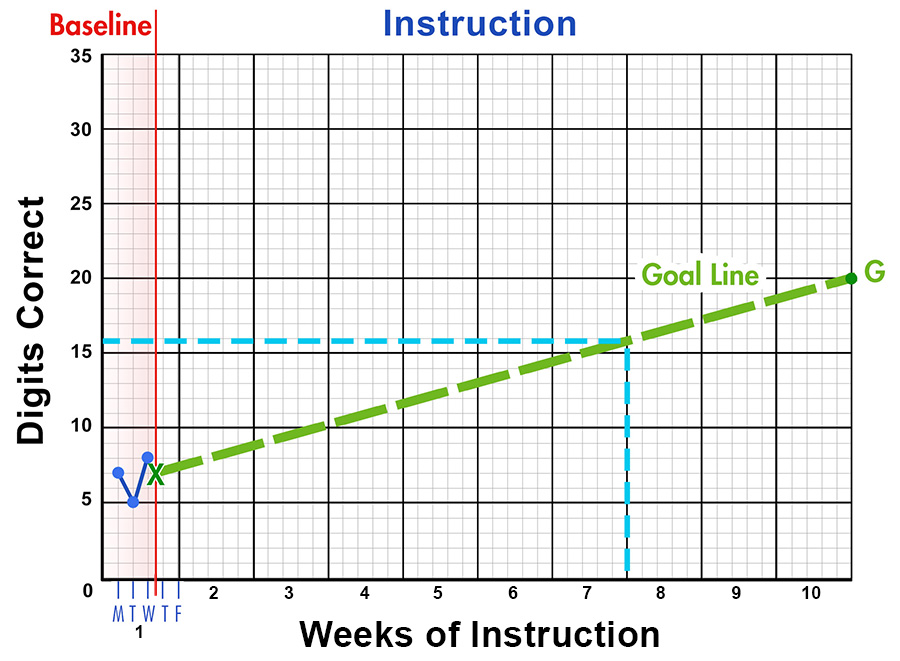
In addition to creating a long-term goal, the educator might want to create a short-term goal to help motivate students to maintain their efforts or improve their performance. Once a goal line has been added to the graph, an educator can set a short-term (e.g., weekly, monthly) goal for a student relatively easily. For example, look at the sample graph below. If establishing a seven-week goal for this student, the educator would find the seven-week mark on the horizontal axis and follow it up to the goal line. The educator would then identify which score aligns with that point on the vertical axis to find the seven-week goal. In the example graph below, the seven-week goal for this student is to correctly solve 16 problems.
Activity
 Lana is a student in Ms. Wu’s second-grade class. Using the provided data, answer each of the questions below and plot Lana’s goal line on the graph.
|
|
|
|
|
|
Determining Individualized Goals for Students
For students whose performance is significantly below grade level, educators often need to set more ambitious goals to close the achievement gap. They can develop individualized goals for these students by using the intra-individual framework—an approach that uses a student’s ROI, instead of benchmarks or goals based on national norms, to determine an individualized goal.
Keep in Mind
Among other things, a student’s IEP contains annual goals. Educators can use progress monitoring to evaluate a student’s progress toward meeting these goals. For more information on how to do so, view the IRIS Center Information Brief:
| Step | Actions | Example |
|
Gather scores |
Gather the student’s most recent six to nine data points. | Colby’s eight most recent test scores: 9, 12, 14, 11, 15, 14, 12, 15 |
| Determine the median scores of the first and third data groups | Divide the data into three relatively equal groups and find the median scores of the first and third groups. |
9, 12, 14, 11, 15, 14, 12, 15 Median of first three test scores: Median of last three test scores: Note: Remember to order the scores from lowest to highest before finding the median scores (i.e., the score that falls in the middle). |
| Find student’s current rate of improvement (i.e., slope) |
ROI (or slope) calculation: 3rd median score – 1st median score / total number of data points – 1 |
Colby’s current ROI = .29 |
| Determine expected ROI |
Multiply the student’s current ROI by 1.5 to get the student’s expected ROI. (Round to the nearest hundredth.) To close the achievement gap, the student needs to make fifty percent more progress than what they are currently making. Therefore, multiply current ROI by 1.5. |
Colby’s current ROI x 1.5 .29 x 1.5 = .44 Expected ROI = .44 |
| Determine amount of growth needed | Multiply the expected ROI by the number of weeks remaining in the school year to determine the amount of growth the student needs to reach the end of the school year. (Round to the nearest whole number.) |
Colby’s expected ROI = .44 Number of weeks remaining = 28 .44 x 28 = 12 By the end of the school year, Colby’s performance should improve by 12 problems correct. |
| Identify end-of-year goal | Add the student’s baseline score (third median score) to the amount of growth needed. |
Baseline score + the amount of growth needed = end-of-year goal 14 + 12 = 26 Colby’s end-of- year goal is 26 problems correct. |
Activity
 Raymond is also a student in Ms. Wu’s class. Because Raymond’s mathematics performance is significantly below grade level, Ms. Wu uses the first-grade computation measure to monitor his progress. Ms. Wu is going to use the intra-individual framework to determine Raymond’s end-of-year goal. Help Ms. Wu by calculating the information needed in each step of the intra-individual framework.
To complete this activity, use the following information:
- Raymond’s eight most recent test scores: 2, 3, 4, 4, 5, 5, 6, 6
- Number of weeks left in the school year: 25
| Step | Answer | |
|
Determine the median scores of the first and third data groups |
Median of the first three test scores Median of the last three test scores |
2, 3, 4, 4, 5, 5, 6, 6 Median of the first three test scores: 2, 3, 4
Median of the last three test scores: 5, 6, 6
|
|
Find student’s rate of improvement, or slope (rounded to the nearest hundredth) |
|
|
|
Determine expected ROI (rounded to the nearest hundredth) |
|
Multiply Raymond’s current slope by 1.5. .43 x 1.5 = .65 (.645) Expected ROI = .65 |
|
Determine amount of growth needed (rounded to the nearest whole number) |
|
Multiply the expected ROI by the number of weeks remaining in the school year. .65 x 25 = 16 By the end of the school year, Raymond’s performance should improve by 16 problems correct. |
|
Identify end-of-year goal |
|
Add the student’s baseline score (third median score) to the amount of growth needed. 6 + 16 = 22 Raymond’s end-of-year goal is 22 problems correct. |