What approaches are available to schools to help struggling readers and to efficiently identify students who need special education services?
Page 2: The IQ-Achievement Discrepancy Model
Click on the movie below to watch the Rosa Parks Elementary School S-Team members discuss their current method of identifying struggling readers (time: 0:53).
Transcript: Identifying Struggling Readers
The S-Team at Rosa Parks Elementary believes that there must be a better way to help their struggling readers. They are also frustrated that so many students have to wait and eventually fail before they can qualify for special ed services. Rosa Parks Elementary, like most schools in the country, uses an IQ-achievement discrepancy model to identify struggling readers who have learning disabilities. This is the traditional method, which has been used for over three decades, so some of the team members assume that it must be a good approach. However, others wonder if the system they are using might be part of the problem. The S-Team members realize that they don’t really know very much about their current process, other than it refers a student to a school psychologist and then test results come back. They decide they should learn more about how the identification process works.
What Is the IQ-Achievement Discrepancy Model?
 The IQ-achievement discrepancy model is the traditional method used to determine whether a student has a learning disability and needs special education services. The discrepancy model is based on the concept of the normal curve (click here for a review of the normal curve). The discrepancy model assesses whether a substantial difference, or discrepancy, exists between a student’s scores on an individualized test of general intelligence (that is, an IQ test such as WISC-IV) and his or her scores obtained for one or more areas of academic achievement (e.g., the Woodcock-Johnson Achievement Test). The accepted criteria for identifying a student as having a learning disability with the IQ-achievement discrepancy is a difference of at least two standard deviations (30 points).
The Normal Curve
Many psychologists, as well as education professionals, medical professionals, and others, are interested in characteristics of people, such as intelligence, academic achievement, height, or weight. When these characteristics are measured in large groups of people, the measurements tend to create a pattern referred to as the normal curve or the bell curve (see Figure A below). Most people have scores or measurements on these characteristics that fall within the average range. The further away from average that a score is, the fewer people will exhibit that score.
Figure A
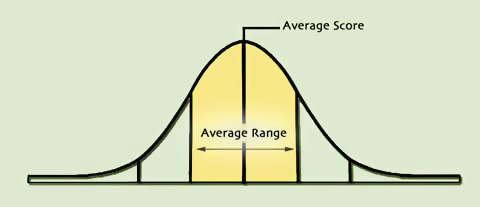
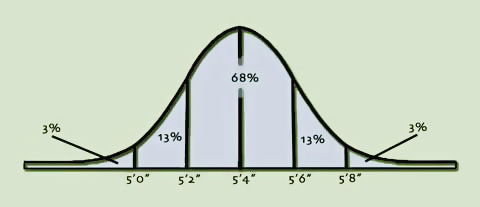
Figure B (below) is based on invented data about women’s height. Let’s use it to illustrate an example. If the average (or mean) height of a woman in the United States is 5’4″, most women (68%) will exhibit a height between 5’2″ and 5’6″. Only 16% (13% + 3%) of women will be taller than 5’6″ and only 3% of women will be taller than 5’8″. The same is true for the other side of the normal curve; 16% of women will be shorter than 5’2″ and 3% will be shorter than 5’0″.
Figure B
(Close this panel)
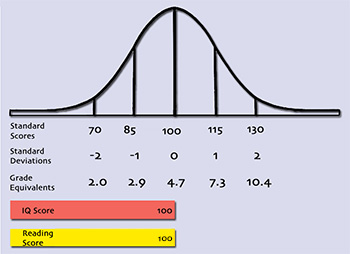
A student with an average IQ score (around 100) is expected to receive average (or grade-level) scores on achievement tests. So a fourth grader with an average IQ score (represented by the red bar in the figure to the left) and a reading achievement score at the fourth-grade level (represented by the yellow bar) is performing as expected.
Terms Used in the Graph
Standard Score is the score obtained on a standardized test, where the mean is set at 100 and the standard deviation is usually set at 15.
Standard Deviation is how much a student’s score deviates from the mean, or average, score.
Grade Equivalents are expressed in the form “grade.months,” so here the “average reader” (4.7) is reading at the level of a student in the seventh month of the fourth grade.
IQ Score is an overall score obtained on a standardized test of intelligence. For the scores shown on this graph, the average scores fall between 85 and 115, and 100 is the mean.
Reading Score is an overall score obtained on a standardized test of reading achievement. For the scores shown on this graph, the average scores fall between 85 and 115, and 100 is the mean.
Discrepancy is the amount of difference between a student’s scores on a standardized test of intelligence and a standardized test of achievement.
(Close this panel)
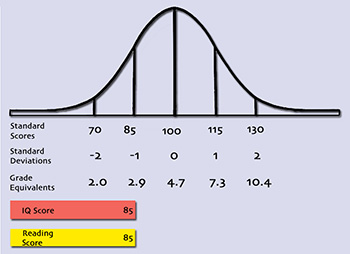 The figure to the right shows scores for a different fourth grader. This student’s IQ score is 85 (again, represented by the red bar), and his reading score is also 85 (represented by the yellow bar), showing that his reading ability is only equivalent to a second-grade level. These scores indicate that this student’s reading ability is commensurate with his intelligence test scores. In other words, one would expect his reading achievement to match his ability level. Unfortunately, though it is obvious that such a student is a “low achiever” and would require extra help, he would not qualify (according to federal law) for special education services as a student with a learning disability.
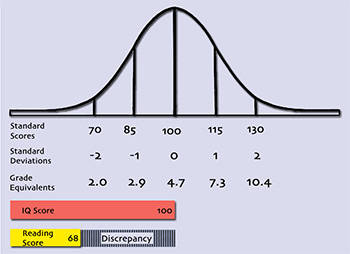
Students with learning disabilities, however, exhibit unexpected learning difficulties because their level of achievement is far below what is predicted by their IQ scores. This figure shows scores for a fourth-grade student who qualifies for special education services because of a reading disability. The student demonstrates a discrepancy between expected achievement and actual achievement. He has an IQ score of 100 (as indicated by the red bar), but his reading score is 68 (as indicated by the yellow bar). Though his IQ score indicates that he should be reading at least at the fourth-grade level, he is instead reading at the first-grade level. Because of the discrepancy, this student has been identified as having a reading disability.
Concerns About the IQ-Achievement Discrepancy Model
Many teachers, like those at Rosa Parks Elementary School, express concern and frustration that the IQ-achievement discrepancy model rarely identifies students with learning disabilities in the early grades. Rather, these students often struggle for years before they are finally identified.
Click on the movie below to learn why it can take so long for students to be identified as having learning disabilities and to then qualify for special education services (time: 1:46).
Transcript: Identifying Learning Disabilities
It can be confusing, at first, to understand why it takes several years for a student to meet the eligibility criteria for a learning disability. Most people ask, “If a student has a learning disability, wouldn’t he or she have one in the first grade as well as in the third grade?” The answer to that question is “Yes!” Unfortunately, current methods just don’t do a good job of identifying learning disabilities during the early elementary-school years.
As students progress through the elementary grade levels, their academic skills should progress at a parallel rate. However, there is a small group of students, those with learning disabilities, who demonstrate average intellectual ability but who lag behind in reading achievement. These students’ reading skills are, in effect, progressing at a snail’s pace while their classmates’ skills are developing much more rapidly. Since the average kindergarten or first-grade student’s reading skills are fairly limited, many assessments are not sensitive to the small gap in skills exhibited by struggling young readers. Since the discrepancy needed to meet the qualifying criteria for a learning disability is quite large, it often takes several years for the gap between the performance of the lagging students and that of their peers’ to become large enough to meet eligibility for special education services.
For this reason, students are often not identified as having a learning disability until the third grade or later. It’s not that their skills are getting worse or that they somehow develop a learning problem somewhere between Kindergarten and third or fourth grade—they’ve been struggling all along. They were just not identified sooner because the IQ-achievement discrepancy was not yet large enough to qualify them for special education services.
Another limitation of the IQ-achievement discrepancy model is that it does not assess or inform the quality of instruction received by students. Some students may be identified as having learning disabilities when, in reality, they simply have not experienced classroom instruction that meets their learning needs. Furthermore, the assessments that are used to identify a learning disability do not yield information that can easily be used to guide subsequent instruction.
Click on the audios below to hear two experts discuss other concerns about the IQ-achievement discrepancy model. Doug Fuchs is a national expert in the areas of reading instruction and learning disabilities. Leonard Baca is a nationally recognized leader in the areas of bilingual and multicultural special education.
Listen as Doug Fuchs discusses the issue of linguistic diversity in relation to administering and scoring progress monitoring probes. Next, listen to Leonard Baca discuss concerns about using Spanish translations of English language assessments.

Doug Fuchs, PhD
Nicholas Hobbs Endowed Chair in Special Education
and Human Development
Peabody College, Vanderbilt University
(time: 1:45)

Leonard Baca, PhD
Director, BUENO Center
for Multicultural Education
University of Colorado, Boulder
(time: 1:05)
Transcript: Doug Fuchs, PhD
A lot of people have raised concerns about the validity of IQ-achievement discrepancy. First, there’s lots of ways of thinking about intelligence not captured by or explored by IQ tests. Second, IQ and academic achievement are presumed to be independent by IQ-achievement discrepancy but, in fact, are often not independent of each other. In the case of word reading, the capacity to read individual words, the skills that underlie that capacity, like phonological awareness, are seen as equally distributed across poor readers with a discrepancy and poor readers without a discrepancy. In other words, the cognitive processes that are presumed connected with early reading acquisition are virtually the same across groups that show an IQ-achievement discrepancy and groups that do not. And so, on this basis, people ask, “Why maintain the distinction?” And then, finally and probably most important, is the criticism that IQ-achievement discrepancy requires many, many, many kids to fail repeatedly before they show a discrepancy. The Office of Special Education Programs, in its Annual Report to Congress, has a very dramatic and persuasive graph showing that when the grade at which most kids are identified as LD is fourth grade. So their achievement has to sink far enough down so that there’s a discrepancy. And that’s a major concern of IQ-achievement discrepancy.
Transcript: Leonard Baca, PhD
The discrepancy model has long been under scrutiny, and perhaps attack, from numerous places because of its lack of a theoretical base primarily. But, also with linguistically different kids, we notice that they tend to show a discrepancy even if they have no learning disability—more of a minor discrepancy between IQ and achievement. So that’s a concern that we’ve expressed all along. But, in addition, it also is a concern, depending on the particular test instruments that you use, you can either widen or narrow that discrepancy. For example, if you give a verbal IQ test, you tend to drive the IQ down. And if you give a nonverbal IQ test, you tend to drive the IQ up. If you were to measure the achievement in the native language, you might be able to raise that achievement score. So part of the concern around the discrepancy was that it was manipulable depending on the instrument you chose.
To summarize, here are some concerns about the IQ-achievement discrepancy model:
- Assessments do not always discriminate between disabilities and the results of inadequate teaching.
- Students can be misidentified due to teacher or testing bias.
- Typically, students must first fail in order to qualify for special education services.
- Results from assessments do not inform the instructional process.
- Many students do not meet the discrepancy criteria but would nevertheless benefit from early identification and support to remediate their skills.
Advantages of the IQ-Achievement Discrepancy Model
Although many professionals are frustrated with the IQ-achievement discrepancy model, the model does possess a few advantages that might appeal to some schools:
- The IQ-achievement discrepancy model is an established practice.
- It is relatively easy to employ.
- A teacher does not have to spend a great amount of time in the identification process because a certified diagnostician or school psychologist conducts the IQ and achievement tests.
- The identification procedure only requires a one-time assessment.