How will Ms. Rollison know whether the intervention is successful?
Page 12: Evaluate the Intervention
 The final step in the FBA process is to evaluate the intervention. At this point, the team analyzes data on both the intervention effectiveness and the treatment integrity.
Intervention Data Analysis
Intervention data analysis helps the team to determine how well the plan is working and whether they need to make any changes in the intervention procedures. As they undertake their analysis, the team will determine whether:
- The intervention is effective (i.e., desirable behaviors increase and undesirable ones decrease)
- The intervention needs to be adjusted
To make this determination, the team compares the intervention data to the baseline data to determine whether the desired change in behavior is in fact occurring. They also analyze the intervention data to determine whether the student is making progress toward meeting the goal(s) stated in the function-based intervention plan.

In David’s case, data were collected every other day (even though the intervention was implemented daily). The team convened after four observations to evaluate David’s response to the intervention.
The graph below shows the data for David’s problem and replacement behaviors. Note that, because the problem and replacement behaviors are incompatible, the percentage of time on-task and off-task should sum to 100%. As one increases, the other decreases by the same amount.
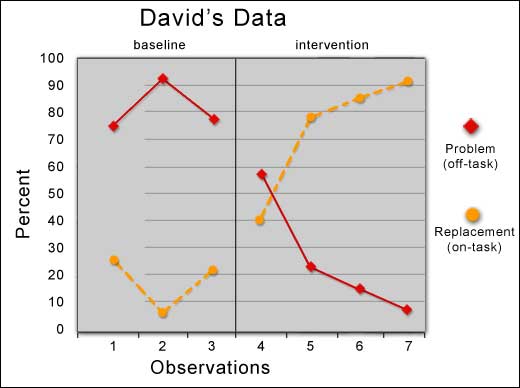
The data on David’s graph indicate that his problem behavior (off-task) has decreased while his replacement behavior (on-task) has increased. The data for the last observation show that David was only off-task 10% of the period, a significant improvement from the first baseline observation when he was off-task for 90% of the time. The team decides that David is making progress, and that his teacher should continue implementing the plan. When the data indicate that David is able to maintain his behavior at this level (e.g., for at least two more observations), his plan will be modified slightly to increase the amount of time that he works independently before asking for teacher feedback.
Keep in Mind
Although there is no specific length of time for which intervention data should be collected or evaluated, below are some guidelines to help in the team’s decision-making. In general, data collection:
- Follows a schedule that is guided by the type and severity of the problem or target behavior and the intervention design.
- Does not occur all day, nor even for an entire period. Instead, data should be collected during the times when the problem behavior can most likely be observed, and then for only a representative period of time.
- Should occur frequently enough (e.g., daily, every other day) to allow the team members to determine whether a behavioral change is occurring.
- Can be reduced (e.g., once per week) when the data indicate that the behavior has reached the desired level for at least three observations.
Implementation Fidelity Data Analysis
If there is little or no change in the student’s behavior, it could be that the intervention is not being implemented as designed. For this reason, it is important to evaluate the implementation fidelity. The team can use this information to determine whether the teacher is implementing the intervention as designed or whether additional training or follow-up with the teacher is warranted.
To determine whether the teacher is following the intervention steps, an observer (e.g., behavior analyst, school psychologist) uses an implementation fidelity observation form. A percentage is calculated based on the number of steps completed with fidelity. Implementation fidelity issues should be addressed before changes in the intervention are considered.

The team also looks at the implementation fidelity data for David’s plan.
The implementation fidelity checklist shows data collected during the first observation. As you can see on the form, the teacher did not implement the intervention with fidelity (i.e., greater than 80%) during the first observation. She receives additional instruction on the details of the implementation plan and subsequently implements the intervention with high fidelity during the remaining observations. Because she implemented the intervention with fidelity during the next two observations, the team determines that they can reduce the frequency of these observations to once per week.
In David’s case, the team includes the teacher’s implementation fidelity data on his graph, using a separate, distinct symbol. They were able to use the same graph because both his intervention and fidelity data were calculated using percentages. By doing this, the team can more easily see whether there is a relationship between implementation fidelity and the student’s behavior.
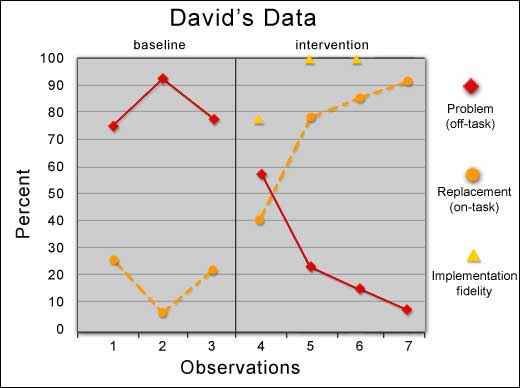
David’s Data graph: This line plot graph shows David’s Data. The x-axis is labeled Observations; observations 1 through 7 are labeled on the axis. The y-axis is labeled percent; 0 to 100 percent is labeled in 10-percent intervals. The graph is divided into two columns, after the third observation. The left column of the graph is labeled “baseline” and the right column of the graph is labeled “intervention.” The first graph of the baseline column is yellow and labeled “Replacement (on-task)” in the key to the right of the graph. This graph has three plot points corresponding with the three observations. The points are at 25%, 5%, and 22%. The second graph of the baseline column is red and labeled “Problem behavior (off-task).” This graph has three plot points corresponding with the three observations. The points are at 75%, 92%, and 78%. The first graph of the intervention column is yellow and labeled “Replacement (on-task)” in the key to the right of the graph. This graph has four plot points corresponding with the two observations. The points are at 40%, 79%, 85%, and 92%. The second graph of the intervention column is red and labeled “Problem behavior (off-task).” This graph has four plot points corresponding with the four observations. The points are at 59%, 21%, 15%, and 8%. There are three points of implementation fidelity plotted on the intervention column of the graph. Implementation fidelity is identified as a yellow triangle, indicated in the key. The three points of implementation fidelity are aligned with the fourth, fifth, and sixth observations and are plotted at the following percentages: 76%, 100%, and 100%.
For Your Information
Here are some things to remember about implementation fidelity:
- Though implementation fidelity of 100% is optimal, 80% or higher is generally acceptable. When implementation falls below 80%, those conducting the intervention should receive additional training.
- In cases of low implementation fidelity, social validity ratings should also be considered. It may be that those involved with the implementation are uncomfortable with one or more intervention components.
Generalization and Maintenance
 David’s intervention has been effective in decreasing his off-task behavior and increasing his on-task behavior in language arts. Now the team needs to consider how to generalize and maintain this behavior. Upon hearing of his success in language arts, David’s math teacher mentions to the team that David also has a hard time staying on-task in math, particularly during independent seatwork time. Once the math teacher receives instruction on how to implement the same intervention, David’s on-task behavior improves in math, too. Both teachers provide positive reinforcement for his on-task behavior, which continues to improve. David’s on-task behavior shows a marked improvement in social studies—a class David listed as one in which he had difficulty staying on-task—even though no formal intervention is initiated there. This suggests that David’s on-task behavior has generalized to other settings.
 The teachers gradually extend the amount of time that David is expected to stay on task. They do this until he can stay on task for the entire ten-minute independent seatwork period with only one initial prompt. The teachers gradually fade that prompt over time, reminding him every other day, then every three days, etc., until he no longer requires it. Maintenance occurs when David is able to stay on task even after all prompts have been faded.
Activity
 Here are the data on Joseph’s target (rude, sarcastic, teasing comments) and replacement (listening and responding in a positive and respectful manner) behaviors. Look at his data and then answer the questions below.
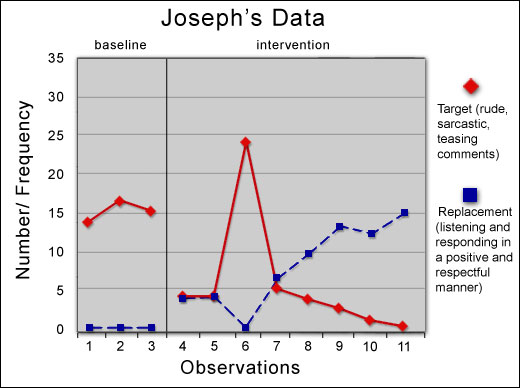
Joesph’s Data: This line plot graph shows Joseph’s Data. The x-axis is labeled “Observations”; observations 1 through 11 are labeled on the axis. The y-axis is labeled “Number/Frequency”; 0 to 35 is labeled in 5-number intervals. The graph is divided into two columns, after the third observation. The left column of the graph is labeled “baseline” and the right column of the graph is labeled “intervention.” The first graph of the baseline column is red and labeled “Target (rude, sarcastic, teasing comments)” in the key to the right of the graph. This graph has three plot points corresponding with the three observations. The points are at 14, 17, and 16. The second graph of the baseline column is blue and labeled “Replacement (listening and responding in a positive and respectful manner).” This graph has three plot points corresponding with the three observations. The points are all at 1. The first graph of the intervention column is red and labeled “Target (rude, sarcastic, teasing comments)” in the key to the right of the graph. This graph has eight plot points corresponding with the eight observations. The points are at 4, 4, 24, 5, 4, 3, 2, and 1. The second graph of the intervention column is blue and labeled “Replacement (listening and responding in a positive and respectful manner).” This graph has eight plot points corresponding with the eight observations. The points are at 4, 4, 1, 6, 10, 13, 12, and 15.
- Do you think the intervention that Ms. Rollison is using with Joseph is working? Explain your answer.
- What do you think happened during Observation #6? Offer three possible explanations.
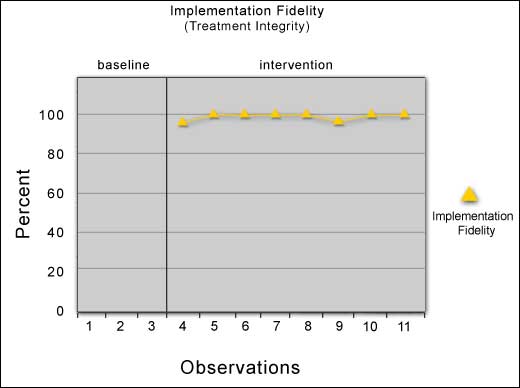
Implementation Fidelity: This line plot graph shows the Implementation Fidelity (Treatment Integrity). The x-axis is labeled “Observations”; observations 1 through 11 are labeled on the axis. The y-axis is labeled Percent; 0 to 100 percent is labeled in 20% increments. The graph is divided into two columns, after the third observation. The left column of the graph is labeled “baseline” and the right column of the graph is labeled “intervention.” There is one line plot graph in the intervention column indicating the Implementation Fidelity from observations 4 through 11. Each plotted point is a yellow triangle, indicating implementation fidelity, as shown in the key to the right of the graph. Points are plotted for each observation 4 through 11 as follows: 98%, 100%, 100%, 100%, 100%, 100%, 98%, 100%, and 100%.
- Here are the implementation fidelity data for Ms. Rollison. After reviewing this information, do you still agree with your answers to Question 2? Why or why not?
Listen as Kathleen Lane discusses Joseph’s data in more detail (time: 2:16).

Kathleen Lane, PhD
Professor of Special Education
University of Kansas
Transcript: Kathleen Lane, PhD
Alright, as we look at the information here in the graph, we begin by looking at the x-axis—that’s the line at the bottom that talks about the number of observations, like one through eleven—and then we see the number of instances of the target behavior, or the replacement behavior, up the y-axis. And when you graph this using numbers, it’s very important to remember that the amount of time you spent with each observation needs to be fixed.
Now, the first three data points are very consistent. When we look at the blue boxes, which is the replacement behavior—which is polite, respectful comments—we see that he had…none. So we’ve got great news. We’ve got plenty of room for improvement there. We also look at the target behavior, and this child was actually doing a lot of the undesirable behavior in terms of instances of rude, sarcastic, or teasing comments. Now, because the data were so stable after the first three data points, they were able to begin the intervention. And at first glimpse, it looks like, wow, this worked great, ’cause on observation sessions four and five you see that the replacement behavior beginning to climb, so he’s starting to do more of what you’d like him to do. And he’s starting to exhibit far less of the target behavior. And then when we get to the sixth data point, we’re, like, whoah! What happened here? And the first thing you might think, well, maybe the teacher had a breach in treatment integrity. Maybe Ms. Rollison actually changed up the intervention a bit. And maybe that’s what caused the target behavior, the undesirable behavior, to jump like that. But now when you look at the treatment integrity data, you can see that she was actually implementing the intervention with a high degree of fidelity. And now, because you are familiar with the initial key principles of behavior specifically regarding extinction, what you’re witnessing here is an extinction burst—that right before problem behaviors drop out completely, there’s often an extinction burst. And it’s also called spontaneous recovery, where it will look like it’s completely gone and then it’ll come back in full force. Well, that appears to be what is the case here. We see a steady decline between observation sessions 7 and 11, with the behavior virtually dropping out. And we see a nice increasing slope in terms of the replacement behavior between observations 7 and 11.
