How can Ms. Rollison determine why Joseph behaves the way he does?
Page 7: Collect Data: Direct Observations

In addition to the information gathered from interviews and rating scales, data from direct observations can offer insight into when, where, and how often a behavior occurs, as well as how long it lasts. A direct observation occurs when someone actually sees the student in the classroom setting and gathers data on the problem behavior. Ideally, an objective observer (e.g., a behavior analyst, a member of the S-Team, another teacher) will collect the data. Direct observations can be used to:
- Conduct an ABC analysis
- Collect baseline data about the problem or target behavior
baseline data
The level at which the behavior occurs before an intervention is implemented. This information is gathered at the beginning of an assessment period for later comparative use.
Conducting an ABC Analysis
 Recall that the ABC model is used to identify the antecedents (A) that set the stage for the problem behavior (B) to occur and the consequences (C) that appear to be maintaining the problem behavior. An observer might collect data over several sessions before obtaining enough information for a clear ABC pattern to emerge. This usually requires eight to ten occurrences of the problem behavior (except in cases of extreme behaviors, such as fighting or self-injurious actions). In addition to recording the ABC events, the observer should note the setting and the time of day in which the behavior took place, as well as the persons involved. Once an ABC analysis has been completed, the team can develop a hypothesis about the function of the behavior. Click here to see David’s A-B-C analysis results.
The video below depicts an interaction between a teacher and a student who refuses to do his work. During the video, Kathleen Lane conducts an ABC analysis, explaining each step and demonstrating how to fill out the recording form (time: 5:07).
View Transcript | View Transcript with Images | Click to view Cameron’s ABC analysis form
Transcript: A-B-C Analysis
Teacher: All right, so today you have your graphic organizers. We’re going to keep working on our stories. You have pictures on your tables, and I’ll be walking around to check to see if you need any help with your trick, okay? So get to work.
Kathleen Lane (voice-over): Okay, in this first instance you saw that the teacher began by stating to the entire class “Here’s what we’re going to do. You’re going to get started on your task. You’re going to use the trick which you see up on the white board.” She’s got POW already written up there, and that stands for “Pick my idea out, Organize my notes, Write and say more.” She’s clarified the task to the class. She’s told everybody she’s going to be walking around to offer any help. And, immediately, the first instance of the target behavior, non-compliance, occurs. Cameron flips his paper over and begins doing something, but it’s not the task that she asked for. So on your sheet, where you have “behavior,” you can write down “non-compliance” because that is the target behavior. He’s not complying. And if you have a very thorough operational definition of non-compliance, you won’t necessarily need to write more, but you might want to. You could write, “Non-compliance, turns paper over, begins writing.”
The column to the left is the antecedent. That’s what was happening in the classroom right before he exhibited non-compliance. In this case, I would simply write, “Teacher provides direction to the whole class on getting started.” The next thing I would write is that the teacher offers assistance, making it clear that she’s going to be walking around the classroom offering help. And, to the left of that, you have the time column, and let’s say that this happens all at 9:04 in the morning. So right now on your sheet you have “9:04.” You have the antecedent condition being “teacher gives directions, offers assistance.” You have the target behavior listed as “noncompliance/ turns paper over/ starts writing.” And let’s see what the consequence is for him.
Teacher: Cameron, we’re working on this side of the paper. Thank you.
Cameron: I don’t want to do this.
Teacher: Cameron, you can focus. You can do this. Think of this, of the tricks. “I can do this.”
Cameron: I don’t want to do this.
Teacher: Cameron…
Kathleen Lane (voice-over): Now, in the next part of the chain, we saw that the teacher walked over to him and was very clear in her consequence and said, “Cameron, we’re working on this side of the page right now.” And that was the consequence for him, so that’s what happened immediately following his non-compliance. She came over and redirected him. So I would in that column write “Teacher redirects.” Now, that consequence actually becomes the antecedent for the next instance of the behavior. And you could simply draw an arrow, if you wanted to, from consequences to the next line in your antecedent chart. Or you could write the exact same wording again, and this time we then see another instance of non-compliance where he says, “I don’t want to do this,” and he throws down his pencil on top of the desk. And you see this is very quick. It’s, like, maybe not even 9:05 yet. But you could write the next time, or you could write “plus 30 seconds.” And then he again has an instance of non-compliance, and let’s see what the new consequence is.
Teacher: Cameron, you can focus. You can do this. Think of this, of the tricks. “I can do this.”
Cameron: I don’t want to do this.
Teacher: Cameron, do you want to go visit the principal?
Cameron: Sure.
(Students laugh.)
Kathleen Lane (voice-over): Now, very quickly you saw again two more instances of non-compliance. She responded by providing encouragement, saying “Remember, use the trick. You can do this.” But that same consequence again served as a prompt, which was the antecedent for his final instance of non-compliance. And he again refused to do the task. And then her consequence that time was to say, “Do you want to go to the principal’s office?” So in each instance you can see it’s escalating, like an acting-out cycle, which you have the opportunity to learn about in another module. We sometimes unintentionally, teachers and students, can escalate each other to the point where this exact thing happens, that teachers reach the limits for which they’re willing and able to tolerate in the classroom. So the ultimate consequence now in this sequence was that he was offered the choice of going to the principal’s office, and he elected to take that option. So now he’s leaving the class. Now, you may notice that some of the students started laughing at that point. When we look at this ABC chart, at first glimpse, it seems to be super cut-and-dry that, yes, this child is clearly escape-motivated. And then we are kind of left wondering, “Is it possible that maybe this child is also maintained by attention?” That may be, but in this instance it’s to a far lesser extent than the main function, which is escape. Sometimes, kids have certain behaviors that are extremely reinforcing because they’re serving more than one function. When I look at this instance, this one snapshot in time of Cameron’s day, if I was coding I would see that in each instance his behavior was being reinforced by escape from task, ’cause he spent time arguing with the teacher rather than doing the assignment, and ultimately he did get some attention at the end, both from the teacher and from the peer.
Activity
This video depicts a scene from Ms. Rollison’s classroom. Use the form below to conduct an ABC analysis of Joseph’s behavior.
Click to download the ABC analysis form (DOC)
View Transcript | View Transcript with Images
Click here to see a completed ABC form on Joseph’s behavior
Transcript: The Rings of Saturn
Ms. Rollison: All right, everybody, before you start working on your science projects, tell me a little about what you’ve discovered in your research on Saturn. T. J.?
T. J.: Yes. There are more than sixty moons that have been discovered so far…
Joseph [interrupting, sing-song]: Siiiixty mooooons.
[Laughter from the class]
Ms. Rollison: Joseph, please raise your hand if you want to say something about Saturn. T. J., please continue.
T. J.: Okay, here I go again! Over sixty moons have been discovered so far, and Titan is the biggest one of all.
Joseph: They’re at the 20, the 10! Touchdown, Titans!
[Laughter from the class]
Ms. Rollison: Joseph, please raise your hand to be called on, and let’s stick to the discussion on Saturn. [Softly, to Joseph only] That was your second reminder. Next time you’ll have to move your desk away from the group. [To the rest of the class] Alright, what else do we know about Titan? José?
José: It was the first moon discovered because it was so big. Also, it’s so big that the other moons around it are affected. Their orbits are changed.
Ms. Rollison: Very nice! OK, let’s move on to Saturn’s rings. Isaura?
Isaura: Our team has been learning about the Cassini spacecraft. It’s been traveling around Saturn and getting all the details and information and taking pictures. It’ll be passing through Saturn’s rings on Friday.
Ms. Rollison: Let’s remember to check the NASA site later in the week and see if they’ve posted anything new. Marcos, what can you tell me about how the rings were named?
Marcos: Their names aren’t very interesting. They were named in alphabetical order in the order they were discovered, so there’s an A-Ring, a B-Ring…
Joseph: I know what the “B-Ring” stands for: BO-RING!
[Gasps of shock from the class]
Joseph: What?
Ms. Rollison: Joseph, that’s enough. Move your desk up here next to mine.
Class: Ooooh, you’re in trouble.
Collecting Baseline Data
Once a clear ABC pattern of behavior has been identified, further observation can provide baseline data about the problem or target behavior. It is important to select a direct observation method that fits the behavior and is feasible in the classroom. Observers should consider one of four direct observation methods when collecting this type of data:
|
} | if length of time is a measurable factor in the problem behavior | ||||
|
} | if the teacher needs to determine how often a behavior occurs |
| Type | Definition | Procedure | Example | View/ Download Form |
| Duration | Length of time that a student engages in a behavior | Start stopwatch when student begins the behavior and stop it when the behavior ends. | How long was Student A out of his seat? View Student A’s duration data |
|
| Latency | How long it takes for the behavior to occur | Start stopwatch when a behavior should start, and stop it when the behavior actually starts. | Once the teacher gives the instructions, how long does it take for Student B to begin working? View Student B’s latency data |
|
| Event | How frequently a behavior occurs within a given period of time | Make tally marks on a piece of paper, use a hand-held tally counter, or any variety of creative options. | How many times does Student C talk out without permission during language arts class? View Student C’s frequency data |
|
| Interval | Whether or not the behavior occurs within a given period of time | Mark a data collection sheet to indicate the presence or absence of a behavior. | Divide the class period into 30-second intervals. During how many intervals does Student D talk out? View Student D’s interval data |
 Before implementing the intervention, baseline data should be collected over three to five observational periods to ensure a representative sampling of the behavior. The same data collection procedures should be repeated once the intervention is implemented. This allows the teacher to compare the intervention data to the baseline data to determine whether the intervention is effective. In David’s case, the team wanted to know how much time he spent off-task, so they selected duration recording.
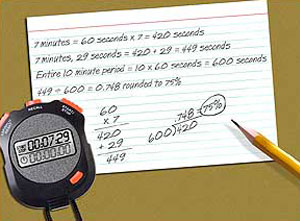
 David’s teacher schedules ten minutes at the end of language arts class for students to work on independent writing assignments. Because the information gathered thus far indicate that this is when David is the most off-task (i.e., out-of-seat behavior), an observer—in this case, a member of the S-Team—takes this opportunity to collect duration data. Whenever David leaves his seat without permission, the observer starts his stopwatch. When David returns to his seat, he stops the stopwatch. He maintains this data collection procedure for the entire 10-minute period. At the end of the period, his stopwatch indicates that David was off-task for 7 minutes and 29 seconds. He divides the 7 minutes and 29 seconds by the entire 10-minute independent work period and determines that David was off-task 75% of the time.
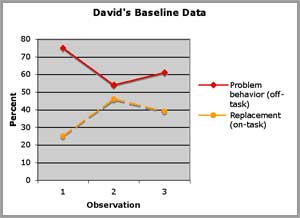
The observer makes two more visits to David’s classroom, collecting data during the independent seatwork period. A relatively stable pattern of out-of-seat behavior emerges:

Observation 1: 75%
Observation 2: 54%
Observation 3: 61%
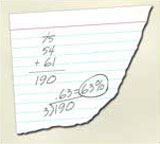
 The baseline data indicate that David is out of his seat an average of 63% of the independent seatwork time, confirming the teacher’s initial concern that David’s off-task behavior is a problem.
David’s Baseline Data graph: This double-line plot graph shows David’s Baseline Data. The x-axis is labeled “Observation”; observations 1 through 3 are labeled on the axis. The y-axis is labeled “percent;” 0 to 80 percent are labeled in 10 percent intervals. The first graph is yellow and labeled “Replacement (on-task)” in the key to the right of the graph. This graph has three plot points corresponding with the three observations. The points are at 25%, 45%, and 40%. The second graph is red and labeled “Problem behavior (off-task).” This graph has three plot points corresponding with the three observations. The points are at 75%, 52%, and 60%.
For Your Information
Data need not be collected throughout the entire day. If, for example, a behavior occurs primarily during independent reading time, data need only be gathered for a portion of that period.
Data may also be collected on replacement behaviors. It may be necessary to have one recording system for the problem behavior and a different system for the replacement behavior.
Activity
 Ms. Rollison has identified the following problem behaviors for Joseph:
- Joseph makes sarcastic and teasing comments after other students answer questions in class.
- Joseph makes rude comments when called on or spoken to by the teacher.


Ms. Rollison has identified the following replacement behaviors for Joseph:
- Joseph will respond in a positive and respectful manner when called on or spoken to by the teacher.
- Joseph will listen without commenting when other students answer questions in class.


