What is RTI for mathematics?
Page 5: Progress Monitoring
 Progress monitoring is a form of assessment in which student learning is evaluated on a regular basis (e.g., weekly, every two weeks) to provide useful feedback about performance to both students and teachers. The primary purpose of progress monitoring in RTI is to determine which students are not responding adequately to instruction. Progress monitoring also allows teachers to track students’ academic progress or growth across the entire school year. It is used in the following ways at the different levels of instruction:
- Tier 1 — Students identified through the universal screening are monitored to assess their response to high-quality core instruction.
- Tier 2 — Students are monitored to assess their response to Tier 2 intervention.
- Tier 3 — Students are monitored to assess their response to intensive intervention; additionally, teachers can use progress monitoring data to tailor their instruction to meet the individual students’ needs.
One common type of progress monitoring is curriculum based measurement (CBM), sometimes referred to as general outcome measurement (GOM). These assessments are useful because:
- Tests (sometimes referred to as probes or measures) take only a few minutes to administer and score and may be given to groups of students.
- Each probe includes sample items from every skill taught across the academic year.
- Probes, administration, and scoring are standardized to produce reliable and valid results.
- Scores reflect even the smallest changes in student improvement.
- Research shows that CBM scores are highly correlated to those on standardized tests.
- Graphs of each student’s scores offer a clear visual representation of her or his academic progress.
Brad Witzel discusses why it is important to use a curriculum based measure that assesses skills a student encounters across the year as opposed to a mastery measurement probe that assesses a single skill (time: 0:43).
mastery measurement (MM)
A form of classroom assessment conducted on a regular basis; once a teacher has determined the instructional sequence for the year, each skill in the sequence is assessed until mastery has been achieved, after which the next skill is introduced and assessed.

Brad Witzel, PhD
Professor of Special Education
Winthrop University
Transcript: Brad Witzel, PhD
Using only single-skill probes is problematic for young children, and it becomes increasingly problematic for secondary level students. Progress monitoring must capture the response to the overall program and not just a single skill. For example, an intervention that targets integers would need a progress monitoring approach to know that that student is not only performing better at integers but their effect on integers is improving their understanding of the core content. So one suggestion for administering better universal screeners and, more so, progress monitoring is to make sure that we’re trying to capture not just what they’re doing for the intervention but also what they’re doing in their core instruction.
For Your Information
Depending on the availability of resources, a teacher might choose to monitor the progress of all students in the general education classroom, and not just those who happen to be struggling. Doing so can indicate whether students are receiving high-quality instruction. Students receiving high-quality instruction will show increased mathematics performance levels and rates of growth across the year. If all students are not demonstrating sufficient improvement in their mathematics skills, inadequate instruction might be the reason, and progress monitoring data can be useful in helping the instructor to tailor instruction to meet the needs of the class.
As we mentioned previously, GOMs can be used to screen students, as well as to identify those who might struggle with mathematics. They can also be used to monitor the progress of students and determine which are not responding to instruction. In mathematics, teachers should administer two types of probes: computation probes and concepts and applications probes. Click on the links below to view samples of each. Note: Because GOMs can be used for universal screening, the examples below are the same as those shown on Page 3.
| Computation Probe | Concepts and Applications Probe* | |
| Measures students’ procedural knowledge (e.g., their ability to add fractions). | Assesses conceptual understanding of mathematics or students’ ability to apply mathematics knowledge (e.g., to make change from a purchase). | |
Elementary |
Secondary |
Elementary |
Sample Elementary Computation Probe
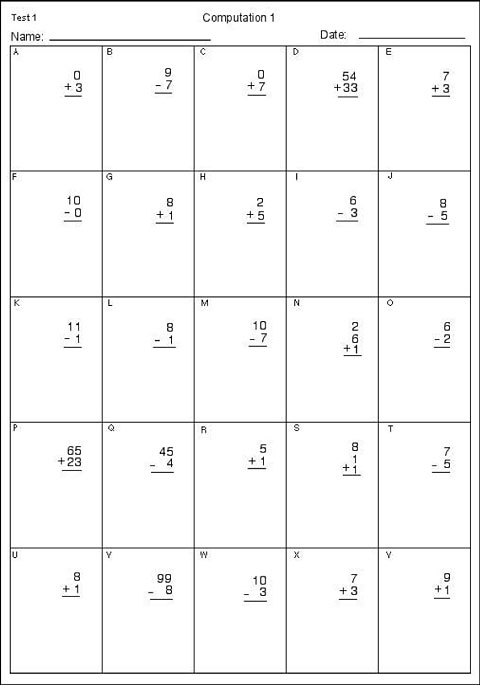
Sample Elementary Computation Probe: This probe is a white sheet of paper with spaces to fill in the student’s name and date across the top of the page. In the upper right-hand corner, the page is labeled “Test 1.” Underneath the name and date, the page is titled in the center “Computation.” The page is divided into five columns and five rows, with each computation problem labeled with a letter of the alphabet. The computation problems are adding two or three single-digit numbers, adding two two-digit numbers without regrouping, subtracting two single-digit numbers without regrouping, and subtracting a single-digit number from a two-digit number.
(Close this panel)
Sample Secondary Computation Probe
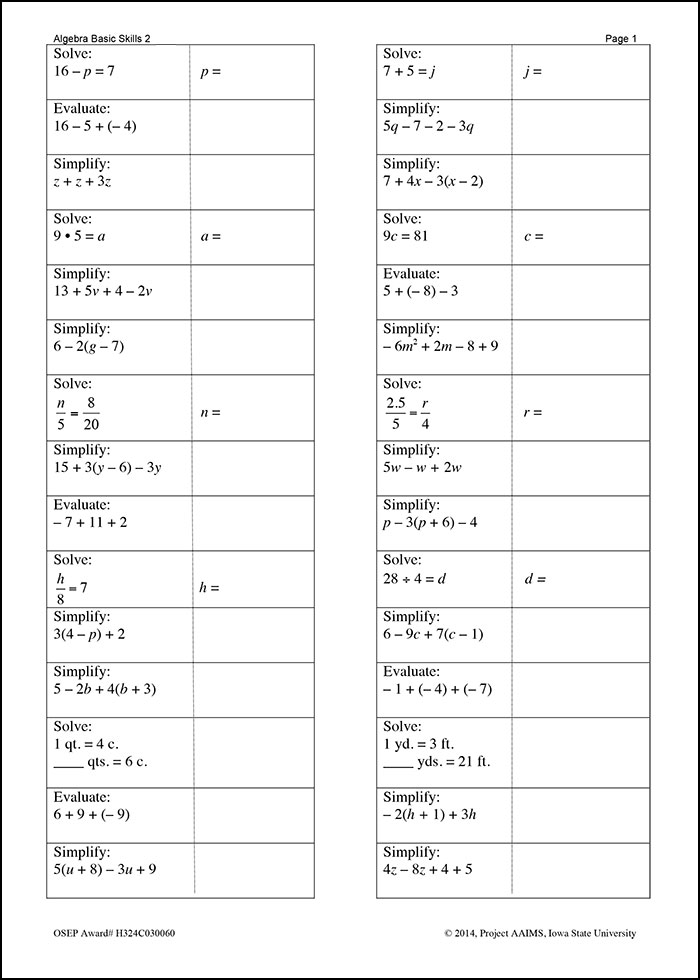
The sample secondary computation probe below is designed to assess students’ basic algebraic skills. Note that a normal probe would contain 60 questions and allow students five minutes to complete them. This 30-item example, which is the first of a two-page probe, is presented here for the sake of brevity and illustrative purposes.
Project AAIMS. (2014). Project AAIMS algebra progress monitoring measures [Algebra Basic Skills, Algebra Foundations]. Ames, IA: Iowa State University, College of Human Sciences, School of Education, Project AAIMS.
This sample secondary computation probe is a single sheet featuring 30 mathematics problems. The questions ask students to solve simple equations (e.g., 16 minus p equals 7, p equals), use the distributive property [e.g., 16 minus 5 plus (negative 4)] , compute with integers (e.g., 9 times 5 equals a), combine like terms (13 plus 5v plus 4 minus 2v), and use proportional reasoning (n over 5 equals 8 over 20, n equals). The top of the sheet is labeled “Algebra Basic Skills 2, Page 1.” Note that this is the first of a two-page computation probe containing 60 questions.
(Close this panel)
Sample Elementary Concepts and Applications Probe
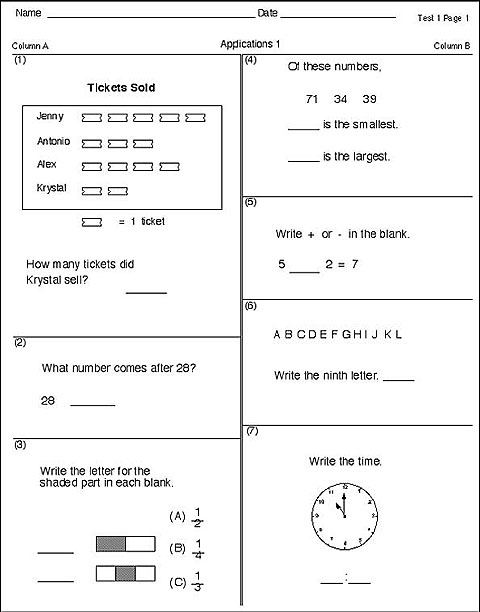
Sample Elementary Concepts and Applications Probe: This graphic is of a sample concepts and applications probe. It is a white sheet of paper with spaces to fill in your name and date across the top of the page. In the upper right-hand corner the page is labeled, “Test 1 Page 1.” Underneath the name and date the page is titled in the center “Applications 1.” The page is divided into two columns, column A labeled on the left and column B labeled on the right. Column A is divided into three uneven rectangles to delineate questions 1 through 3. Question 1 shows the title, Tickets Sold, with a picture graph below. Four names are listed—Jenny, Antonio, and Alex, Krystal—with variable pictures of tickets lined up beside their names. Underneath the names is a key, showing a picture of one ticket as equal to 1 ticket. Below the picture graph is the question: How many tickets did Krystal sell?, with a space to put an answer. There is a dividing line before question 2. Question 2 asks “What number comes after 29?” Below the question is the number 29 with a space to the right of the number to place an answer. There is another dividing line before question 3. Question 3 states “Write the letter for the shaded part in each blank.” Two blanks are provided, one on top of the other. To the right of each blank is a rectangle that is partly shaded. To the right of the shaded rectangles are three answer choices, one on top of the other. Answer choice A is 1/2, answer choice B is 1/4, and answer choice C is 1/3. Column B is divided into four uneven rectangles to delineate questions 4 through 7. Question 4 has the beginning phrase “Of these numbers…” then the numbers 71, 34, and 39 written below. Below the numbers is a blank then the text “is the smallest?” Below that statement is another blank and the text “is the largest?” There is a dividing line and then question 5 which states “Write + or – in the blank.” Below the text is the following incomplete number sentence: 5_____2 = 7. Question 6 begins under another dividing line and lists the alphabet letters ABCDEFGHIJKL. Below the letters is the statement “Write the ninth letter” with a blank to the right of the statement to fill in an answer. The last question, question 7, begins after the dividing line. It states “Write the time.” There is a picture of a clock with the hour hand pointing to the 10 and the minute hand pointing to the 12. Below the clock is a blank, then a colon, and another blank to record the time on the clock.
(Close this panel)
* No valid middle or high school concepts and applications probes are available at this time.
For Your Information
 The National Center on Intensive Intervention provides a tools chart that presents information about commercially available progress monitoring probes that have been reviewed by a panel of experts and rated on key features. Click here to use this tool chart.
There is a lack of available validated measures to assess the mathematics skills of high school students. This is especially true of measures that assess students’ conceptual understanding. David Allsopp discusses an option for assessing this type of understanding (time: 1:56).
David Allsopp, PhD
Assistant Dean for Education and Partnerships
University of South Florida

Transcript: David Allsopp, PhD
I think we need to be looking at ways to more qualitatively understand how kids are developing their mathematical thinking. One is really having measurement tools that get at the complexity and the importance of mathematical thinking. The reality is that being able to quickly evaluate where students are from a progress monitoring perspective, there’s always going to be this focus mostly on procedural knowledge. Are we also going to evaluate conceptual understanding? They’re not separate entities. They’re important, both of them, to assess.
On the other hand, I think there definitely are formative and informal assessment options that can be really powerful for teachers to really get at what students are thinking, what they’re understanding. One is diagnostic interviews, where students talk through what they did and why they did it in terms of problem solving. And as you’re listening what students are saying and the extent to which they have misconceptions or if they are applying a concept incorrectly or if they have a procedure mixed up, this is a way that educators can better understand where kids are in terms of their thinking about a particular application or procedure or problem-solving context so that they can better target their intervention to address those areas. If we just are looking at student’s responses and whether they’re right or wrong, we don’t necessarily have a very good understanding of why it’s right or wrong. That’s a really important component to being able to really, precisely intervene with kids when they’re struggling in mathematics.
Keep in Mind
To track student growth across time, each probe includes sample items from skills taught throughout the academic year. Though students are at first expected to correctly solve relatively few problems, their scores should improve as the academic year progresses and they learn new skills and concepts.
Lynn Fuchs talks more about the benefits of using progress monitoring probes that sample the entire year’s curriculum (time: 1:57).

Lynn Fuchs, PhD
Dunn Family Chair in Psychoeducational Assessment
Department of Special Education
Vanderbilt University
Transcript: Lynn Fuchs, PhD
It’s most always the case that progress monitoring probes that sample the entire year’s curriculum, rather than a single skill, will provide teachers with more useful information for program planning but also be more representative of the student’s overall response to the curriculum. Sampling the annual curriculum in the same way over time, we can compare a student’s performance in October to a student’s performance a month later and a month after that and so on, which helps us understand their response to the overall program, not just a particular skill in the program. When we have a single skill that’s used for progress monitoring, it’s not unusual for teachers to fix on that particular skill for instruction. The student improves on that skill, and the school uses that as evidence that the student has responded and no longer has difficulty, but it’s only a single skill. Multiple skills representing the annual curriculum work well to provide accurate progress monitoring information. I think it’s important when you’re progress monitoring to represent the comprehensive curriculum, and that way we can pinpoint students who are having difficulty in some components but not others. And that way we can gear instruction to the kinds of difficulties students are specifically experiencing. And if we don’t have the entire curriculum represented then we run into problems where we get falsely optimistic about a student’s performance, but we don’t have the whole curriculum worth of information to understand where there may be some serious problems.
Administering, Scoring, and Graphing Progress Monitoring Probes
Every progress monitoring probe has specific administration and scoring guidelines that instructors should carefully follow to ensure fidelity and accuracy of measurement. Students’ scores should be graphed to create a visual representation of student performance over time.
Probes are timed, and students complete as many problems or questions as possible in the allotted period. To restate: Individual administration is required when early numeracy skills like oral counting or identifying numbers are being assessed. In the case of older students, group administration typically ranges from two to ten minutes, depending on the grade level and the type of measure. When feasible, teachers can administer computer-based screening measures.
Each time student progress is measured, an alternate form of the probe should be administered. Student progress is monitored using the same procedures and measures across all intervention levels; however, the frequency of progress monitoring may vary:
- Tier 1 — In general, at least once a month; every week or every other week for students identified as struggling by the universal screening
- Tier 2 — At least once per week
- Tier 3 — Once or twice per week
Tips for Administering Probes
- Educators should establish consistent administration procedures. Doing so will allow them to compare students’ performance across time to be sure their scores are accurate reflections of their ability and not the result of inconsistent administration.
- Educators should administer both computation probes and concept and application probes at the same time of day, back to back, and in the same order.
- For students with disabilities whose IEPs specify accommodations, educators should make sure those students receive the accommodation every time a probe is administered.
For Your Information
During core instruction, teachers might need to monitor the progress of students whose universal screening scores are slightly above the benchmark weekly or every other week. Although currently performing in the expected range, these students might be at-risk for experiencing difficulty with mathematics at a later date. Ongoing progress monitoring helps teacher detect these difficulties relatively quickly.
In general, scoring a computation or a concepts and applications probe is simply a matter of determining how many items the student solved correctly. Commercially available probes include detailed scoring procedures that are standardized to produce reliable and valid scores. Incorrect scoring can lead to inaccurate and misleading conclusions.
In the case of elementary students, computation probes can be scored either according to the number of digits correct or by the number of correctly answered problems. Regardless of which method they choose, teachers in all classes and grades at a given school should score probes in the same way so that the scores are comparable. Click on the links below for examples of scored probes.
- Elementary computation probe scored by number of digits correct and by number of problems correct
- Secondary algebra probe scored by number of problems correct
Sample Scored Elementary Probe
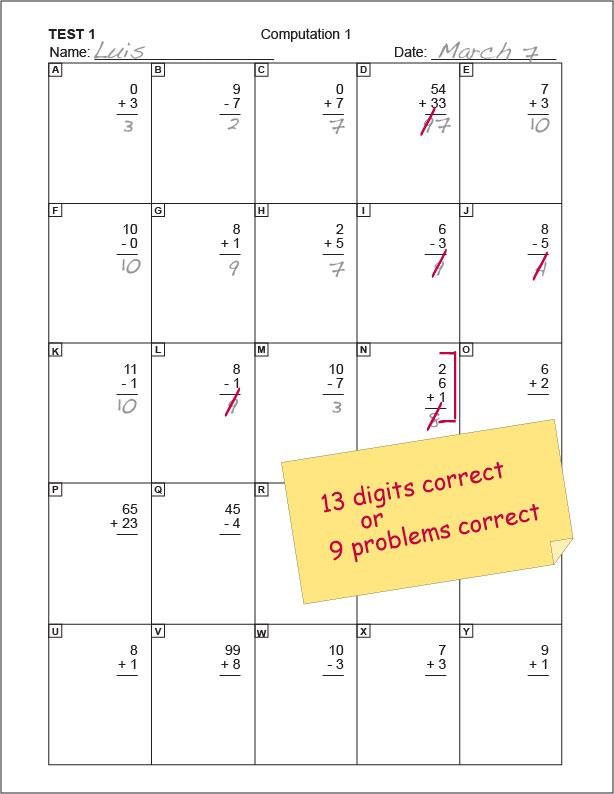
The following elementary computation probe has been scored using two different methods: scoring by number of digits correct and scoring by number of problems correct.
This sample secondary computation probe is a single sheet featuring 30 mathematics problems.The questions ask students to solve simple equations (e.g., 16 minus p equals 7, p equals), use the distributive property [e.g., 16 minus 5 plus (negative 4)] , compute with integers (e.g., 9 times 5 equals a), combine like terms (13 plus 5v plus 4 minus 2v), and use proportional reasoning (n over 5 equals 8 over 20, n equals). The top of the sheet is labeled “Algebra Basic Skills 2, Page 1.” This is Anna’s probe. Her name is written in the top left-hand corner next to the words “Scoring Check Sheet.” Near the top right-hand corner, the number 22 is circled. This indicates the total number of problems that Anna answered correctly out of 60, and therefore her final score. In the bottom right-hand corner is the number 14, indicating the number of problems Anna worked correctly out of the 30 items on this page. Her teacher has scored the probe by marking 14 correct answers with a “C” and 10 incorrect ones with a slash mark. She has 6 skipped problems that Anna did not attempt to answer.
(Close this panel)
Sample Scored Secondary Probe
Computation probe: This is a sample scored first grade computation probe. It is a white sheet of paper with spaces to fill in your name and date across the top of the page. In the upper right-hand corner the page is labeled “Test 1.” Underneath the name and date the page is titled in the center “Computation.” The page is divided into 5 columns and 5 rows, with each computation problem labeled with a letter of the alphabet. The computation problems are addition or subtraction of 2 or 3 numbers. The student’s name, Luis, and the date, March 7, is filled in at the appropriate spaces at the top of the page. Luis completed questions A through N. Questions D, I, J, L, and N are marked incorrect with a red pen slash through the incorrect answer. There is a yellow sticky note on top of the page that says “13 digits correct or 9 problems correct” in red ink.
- Ignore skipped problems
- Accept mathematically equivalent answers
- Mark correct answers with a “C”
- Mark incorrect answers with a slash (/)
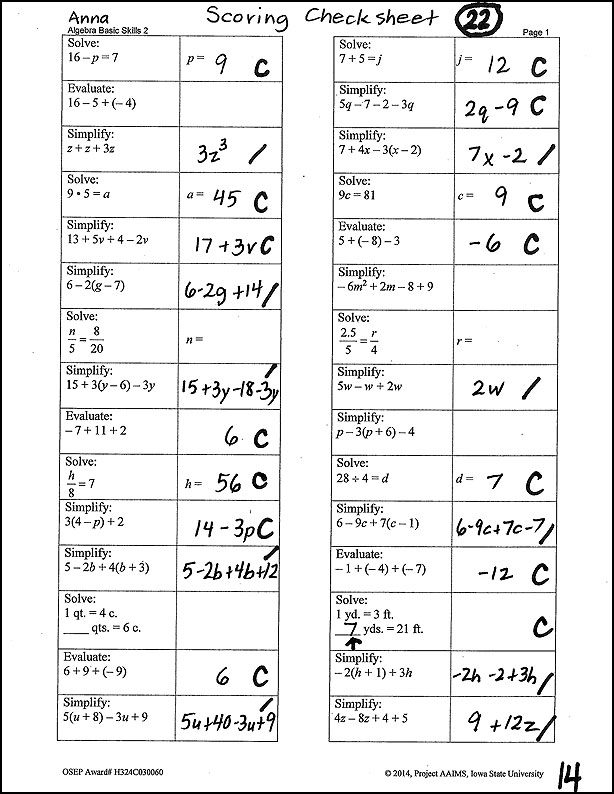
Anna’s final score on the probe is the number of questions she answered correctly.
Project AAIMS. (2014). Project AAIMS algebra progress monitoring measures [Algebra Basic Skills, Algebra Foundations]. Ames, IA: Iowa State University, College of Human Sciences, School of Education, Project AAIMS.
This sample secondary computation probe is a single sheet featuring 30 mathematics problems.The questions ask students to solve simple equations (e.g., 16 minus p equals 7, p equals), use the distributive property [e.g., 16 minus 5 plus (negative 4)] , compute with integers (e.g., 9 times 5 equals a), combine like terms (13 plus 5v plus 4 minus 2v), and use proportional reasoning (n over 5 equals 8 over 20, n equals). The top of the sheet is labeled “Algebra Basic Skills 2, Page 1.” This is Anna’s probe. Her name is written in the top left-hand corner next to the words “Scoring Check Sheet.” Near the top right-hand corner, the number 22 is circled. This indicates the total number of problems that Anna answered correctly out of 60, and therefore her final score. In the bottom right-hand corner is the number 14, indicating the number of problems Anna worked correctly out of the 30 items on this page. Her teacher has scored the probe by marking 14 correct answers with a “C” and 10 incorrect ones with a slash mark. She has 6 skipped problems that Anna did not attempt to answer.
(Close this panel)
Lynn Fuchs points out several issues that school personnel should consider as they decide whether to score probes by the number of correct digits or correct problems (time: 0:53).
Lynn Fuchs, PhD
Dunn Family Chair in Psychoeducational Assessment
Department of Special Education
Vanderbilt University

Transcript: Lynn Fuchs, PhD
If we score by problems, it can be more difficult to see small amounts of improvement. It’s sort of analogous to if you had a scale for measuring your weight, and it only indexed five-pound intervals instead of one-pound intervals, you wouldn’t see any improvement until you gained or lost five pounds. Sometimes, students will improve in their performance, and we will see that sooner when we score digits than if we wait for them to get entire problems correct. There is a disadvantage in scoring digits, in that it requires more skill in the scoring personnel. That can be more time consuming. I think accuracy is very important, and a school has to make a determination about how they can insure accuracy.
For students in middle and high school, scoring probes using digits correct is not recommended. Instead, problems should be scored by the number of problems correct. In the case of multi-step problems, partial credit can be given for correctly performed steps. Brad Witzel discusses the reasoning behind this latter approach (time: 1:04).

Brad Witzel, PhD
Professor of Special Education
Winthrop University
Transcript: Brad Witzel, PhD
I have some caution in digits-correct versus incorrect. I propose that we assess middle school- and high school-level probes through a procedural facility. So think what are the reasonable steps that a student must know in order to solve an equation accurately? Then we assess the student based on their approach, along with reasoning of that approach. When we grade by steps, in tackling a multi-step complex problem, you’re able to determine not only if the answer is correct but how the student accomplished their goal. More importantly, if the student’s answer is incorrect, you won’t just say the problem’s wrong, the student needs to learn the whole process again. That’s not true.
If you grade it by these incremental steps, you’ll be able to determine why the problem was incorrect and then set up a targeted intervention to help that student with that one error. This approach allows you to identify procedural misunderstandings and even set up a follow-up interview to reveal their reasoning issues as well.
Most companies that provide progress monitoring measures also include a tool that scores and graphs student data. Alternatively, the teacher or the student can graph the data on paper or by using a graphing program or application. Regardless, by examining the data on the CBM graph, the teacher can determine whether a student is making adequate progress.
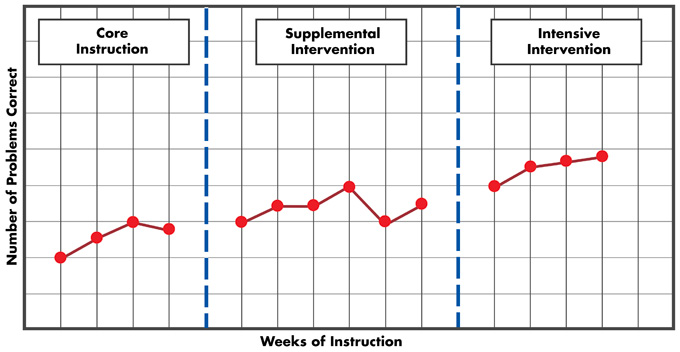 To the right is a sample CBM graph. The vertical axis (y) represents the range of possible scores a student can obtain on the progress-monitoring probe (e.g., the number of problems correct). The horizontal axis (x) represents the number of weeks of instruction. It is recommended that—for students receiving supplemental or intensive intervention—scores should continue to be plotted on their existing progress monitoring graphs. The instructor should draw a dotted vertical line to indicate when a new intervention begins (e.g., changing from supplemental or intensive intervention). This will allow school personnel to compare progress made during the different tiers of intervention.
For Your Information
Students who are aware of their progress are more knowledgeable about their learning. When they see their academic growth in an easily understood format-such as on a graph-students begin to recognize the relationship between their efforts and progress. The benefits of using graphs in this way include:
- Offering students a visual representation of their progress
- Providing students with evidence that their hard work is paying off
- Motivating students to continue their efforts or to work harder
For more information about how to administer, score, and graph progress monitoring data, please visit the IRIS Module and Case Study Unit:
Activity
Imagine you are providing Tier 2 intervention to a small group of students. In the demonstration above, Student 1 and Student 2’s progress monitoring data were examined and instructional decisions were made. Following the same procedures, make instructional decisions for the remaining students in your group. Click on each to make an instructional decision for that student.
| Student A: Elementary Student | Student B: Secondary Student |
Activity: Student A: Elementary Student
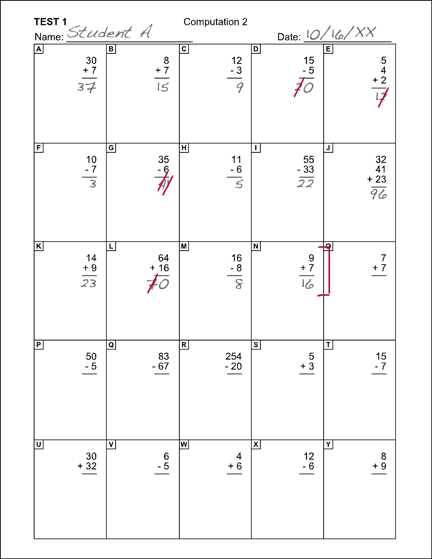
You are now ready to score Student A’s probe for week 4 and graph her data. Begin by scoring Student A’s probe on the right for digits correct. Next, score the probe for problems correct. Enter your answers below.
Correct
Correct
Now, on the graph below, plot the number of digits correct for weeks 1 through 4. The box below contains Student A’s progress monitoring data for weeks 1 through 3.
- Week 1=14
- Week 2=13
- Week 3=16
Description of Student A’s Probe
This sample elementary school math probe consists of 25 simple addition and subtraction problems labeled A through Y. For example, Problem A reads 30 + 7, while Problem Y is 8 + 9. This is Student A’s probe. On Problem D (15 – 5), Student A added instead of subtracting, getting one out of the two digits incorrect. For Problem E (5 + 4 + 2), Student A added the numbers but arrived at an incorrect sum, again getting one of the two digits correct. On Problem G (35 – 6), Student A once more adds instead of subtracting, this time getting both digits incorrect. For Problem L (64 + 16), Student A added correctly but forgot to carry the one, again getting one of the two digits correct. The teacher has marked Problem L with a red bracket, indicating that this was Student A’s final attempted problem.
Activity: Student B: Secondary Student
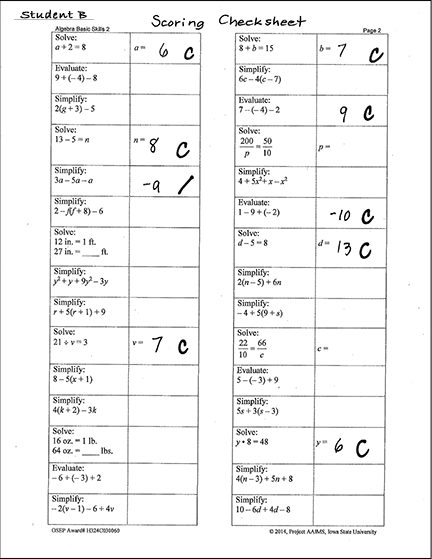
You are now ready to score Student B’s probe for week 4 and graph his data. Note that a normal probe would contain 60 questions and allow students five minutes to complete them. This 30-item example, which is the first of a two-page probe, is presented here for the sake of brevity and illustrative purposes. When calculating Student B’s score, keep the following scoring rules in mind:
- Ignore skipped problems
- Accept mathematically equivalent answers
- Mark correct answers with a “C”
- Mark incorrect answers with a slash (/)
Enter your answer below.
Correct
Description of Student B’s Probe
This sample secondary computation probe is a single sheet featuring 30 mathematics problems.The questions ask students to solve simple equations (e.g., a plus 2 equals 8, a equals), use the distributive property [e.g., 2 (g plus 3) minus 5] , compute with integers (e.g., 13 minus 5 equals n), combine like terms (y squared plus y plus 9y squared minus 3y), and use proportional reasoning (200 over p equals 50 over 10, p equals). The top of the sheet is labeled “Algebra Basic Skills 2, Page 2.” This is Student B’s probe. “Student B” is written in the top left-hand corner next to the words “Scoring Check Sheet.” Student B’s teacher has scored the probe by marking 8 correct answers with a “C” and 1 incorrect one with a slash mark. The teacher skipped the 21 problems that Student B did not attempt to answer.
- Week 1 = 8
- Week 2 = 9
- Week 3 = 7
Now, on the graph below, plot the number of problems correct for weeks 1 through 4. The box below contains Student B’s progress monitoring data for weeks 1 through 3.
