How can teachers effectively implement RTI for mathematics?
Page 9: Implementation at Lyle Elementary
Did You Know?
![]() Principals and all school staff must keep in mind that the adoption and complete implementation of RTI requires a change in existing school processes and is a long-term commitment, usually three to five years.
Principals and all school staff must keep in mind that the adoption and complete implementation of RTI requires a change in existing school processes and is a long-term commitment, usually three to five years.
In the Challenge, you learned that for the past two years, the teachers at Lyle Elementary have been implementing high-quality mathematics instruction in the general education classroom. Although they did see an improvement in student performance on year-end standardized tests, they noted that far too many students were continuing to struggle. To identify struggling students earlier and to address their needs in a more expeditious manner, the staff at Lyle Elementary have decided to adopt the RTI framework. Ms. Shockley’s implementation of RTI for mathematics in her 2nd-grade classroom is highlighted below and follows the procedures in the Lyle Elementary RTI Manual. To review these procedures, click the link below.
Universal Screening
Universal screening includes two measures: a computation probe and a concepts and applications probe. During the third week of school, Ms. Shockley administers the Brand 123 2nd-grade computation probe to her class. For the group administration, the students are given two minutes to correctly solve as many problems as possible. The next day, Ms. Shockley administers the Brand 123 2nd-grade concepts and applications probe. The administration of this measure takes eight minutes. Of her 24 students, four are identified by the universal screening as struggling with math: TaShonda, Luis, Olivia, and Jacob.
High-Quality Instruction
 During the 50-minute mathematics period, Ms. Shockley uses the standards-based mathematics curriculum adopted by Lyle Elementary. When she teaches this curriculum, she uses evidence-based practices such as explicit, systematic instruction; visual representations; schema instruction; and metacognitive strategies. In addition, she employs effective classroom practices like encouraging student discussion and presenting and comparing multiple solutions.
| Schedule | Grouping | Instruction | Strategies |
| 8:00–8:15 | Whole group |
|
|
| 8:15–8:35 | Small group |
|
|
| 8:35–8:50 | Independent or pairs |
|
|
Progress Monitoring
Following the universal screening, Ms. Shockley monitors the progress of the four students identified as struggling. For each of the next seven weeks, she administers Brand 123 2nd-grade computation probes and concepts and applications probes to this group of students. She scores each probe and allows the students to graph their progress. Click on each student’s photo to view her or his data.


TaShonda’s Tier 1 Data
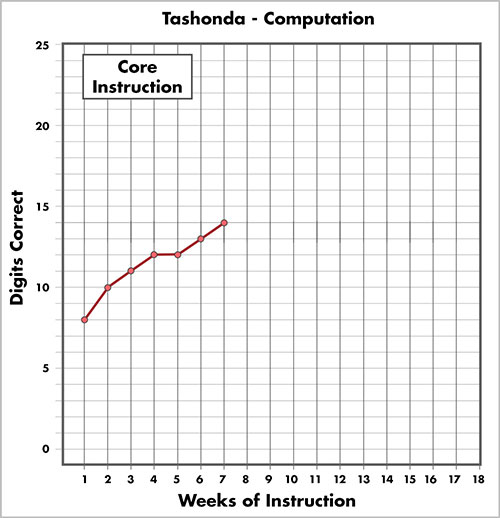
Brand 123 Criteria
Performance level = 10*
Slope greater than .20
TaShonda’s Performance:
Performance level = 13.5
Slope = .85
*Digits correct
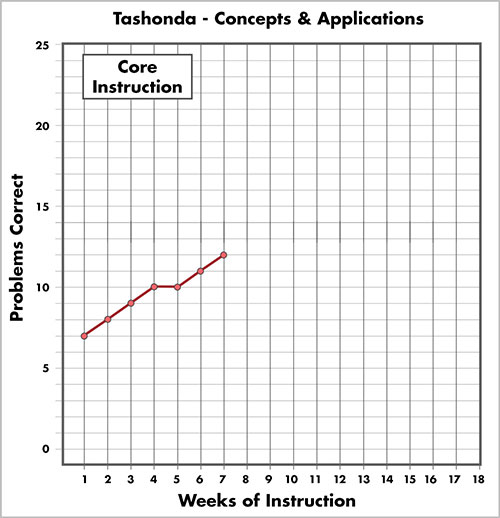
Brand 123 Criteria
Performance level = 10**
Slope greater than .30
TaShonda’s Performance:
Performance level = 11.5
Slope = .71
**Problems correct
(Close this panel)
Luis’s Tier 1 Data
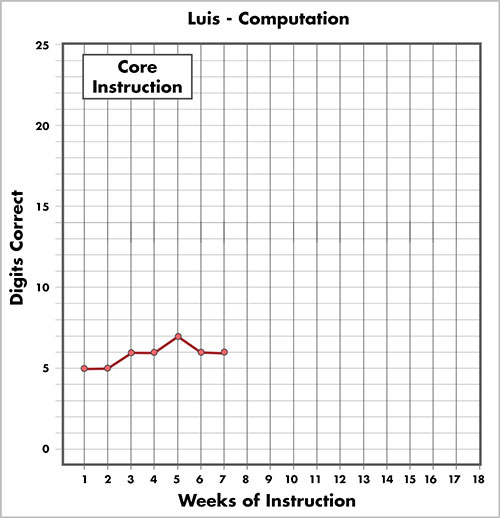
Brand 123 Criteria
Performance level = 10*
Slope greater than .20
Luis’s Performance:
Performance level = 6
Slope = .14
*Digits correct
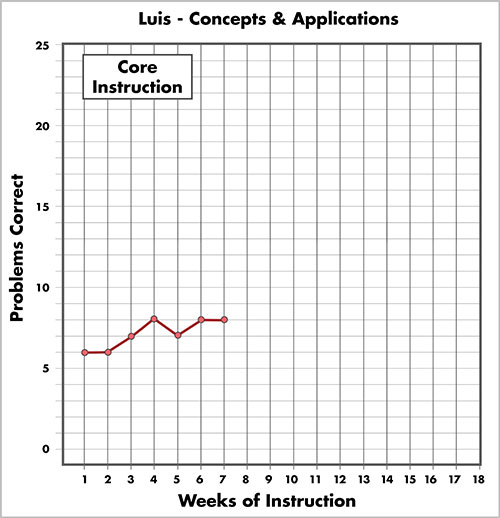
Brand 123 Criteria
Performance level = 10**
Slope greater than .30
Luis’s Performance:
Performance level = 8
Slope = .14
**Problems correct
(Close this panel)
Olivia’s Tier 1 Data
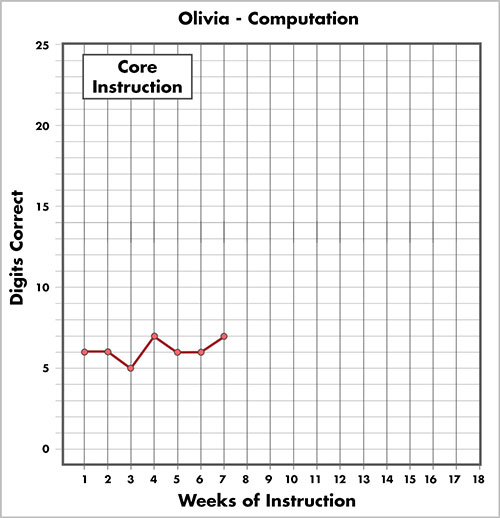
Brand 123 Criteria
Performance level = 10*
Slope greater than .20
Olivia’s Performance:
Performance level = 6.5
Slope = .14
*Digits correct
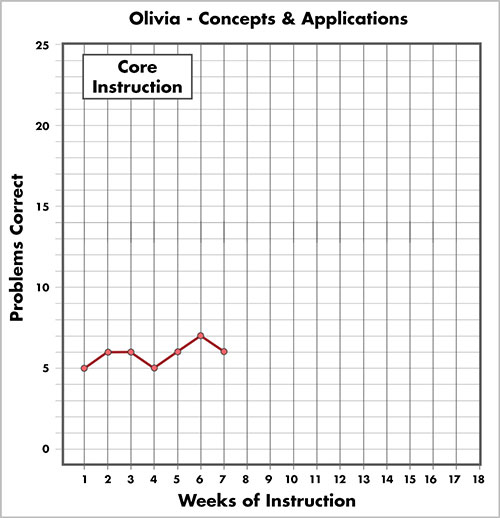
Brand 123 Criteria
Performance level = 10**
Slope greater than .30
Olivia’s Performance:
Performance level = 6.5
Slope = .14
**Problems correct
(Close this panel)
Jacob’s Tier 1 Data
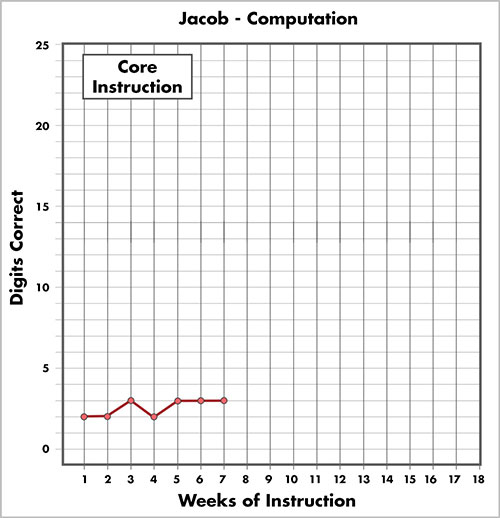
Brand 123 Criteria
Performance level = 10*
Slope greater than .20
Jacob’s Performance:
Performance level = 3
Slope = .14
*Digits correct
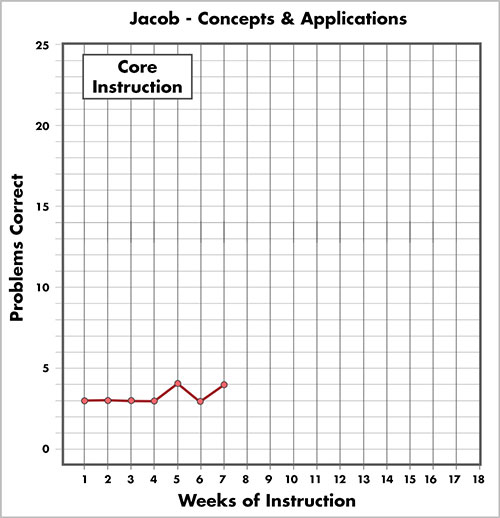
Brand 123 Criteria
Performance level = 10**
Slope greater than .30
Jacob’s Performance:
Performance level = 3.5
Slope = .14
**Problems correct
(Close this panel)
Data-Based Decisions (Tier 1)
At the end of seven weeks of progress monitoring, Ms. Shockley and the other members of the 2nd-grade team meet to review the data for their struggling students. As they do so, they consider both slope and performance level. The table below displays the data-based decisions the team made for Ms. Shockley’s students.
| Student | Does Performance Level Meet Criteria? | Does Slope Meet Criteria? | Data-Based Decision |
| TaShonda | YES | YES | Receive Tier 1 instruction only |
| Luis | NO | NO | Requires Tier 2 intervention |
| Olivia | NO | NO | Requires Tier 2 intervention |
| Jacob | NO | NO | Requires Tier 2 intervention |
Fidelity of Implementation

To ensure that RTI is implemented in the manner outlined by the research, the principal at Lyle Elementary conducts fidelity checks to monitor teachers’ implementation of the RTI approach (i.e., universal screening, high-quality instruction, progress monitoring, and data-based decision making). Because Lyle is a relatively small school, the principal observes all classroom teachers’ instruction, including Ms. Shockley’s, a minimum of three times per year: following the fall and winter universal screenings and also in April. In addition, she attends a minimum of thirty-percent of the data-based decision team meetings for each grade level. The teachers in each grade level observe each other during universal screening administration and progress monitoring procedures to make sure that all are using the correct administration and scoring procedures.
During fidelity checks, the principal observes that for the most part teachers are implementing high-quality instruction. This may be a result of the emphasis on mathematics instruction for the past several years. However, fidelity checks of their progress monitoring scoring procedures revealed that some teachers were counting problems when they were supposed to be counting digits. For these teachers, re-training with follow-up support was provided. Subsequent fidelity checks indicated that all teachers had mastered the scoring of probes. If you would like to learn more about fidelity of implementation, we encourage you to take a look at the IRIS Module:
Data-Based Decisions (Tier 2)
At the end of 10 weeks, Ms. Shockley meets with the teacher providing the Tier 2 mathematics intervention to review the data for her students. As they review each student’s data, they consider both slope and performance level. Click on each student’s photo below to view their data and the instructional decisions made by Ms. Shockley and the Tier 2 teacher.
Luis’s Tier 2 Data
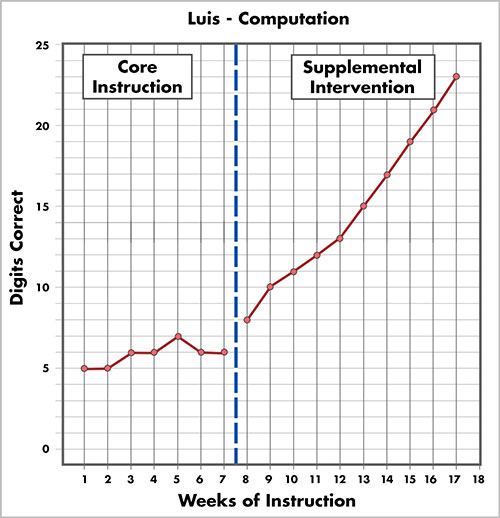
Brand 123 Criteria
Performance level = 20*
Slope greater than .40
Luis’s Performance:
Performance level = 22
Slope = 1.66
*Digits correct
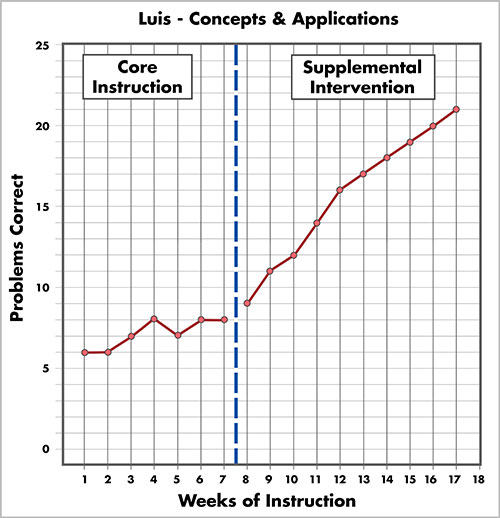
Brand 123 Criteria
Performance level = 20**
Slope greater than .40
Luis’s Performance:
Performance level = 20.5
Slope = 1.33
**Problems correct
Instructional decision: Luis has responded well to supplemental intervention. He will discontinue Tier 2 intervention and receive Tier 1 instruction only.
(Close this panel)
Olivia’s Tier 2 Data
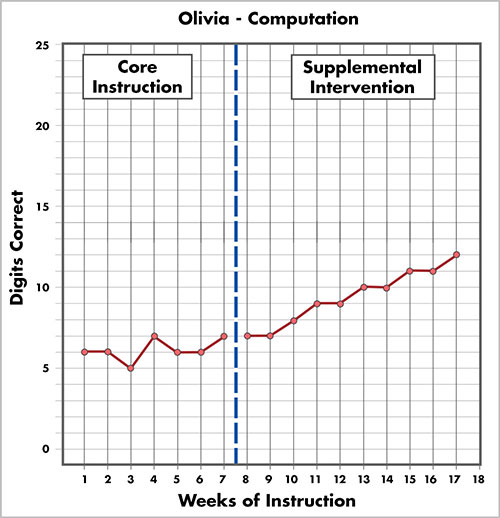
Brand 123 Criteria
Performance level = 20*
Slope greater than .40
Olivia’s Performance:
Performance level = 11.5
Slope = .50
*Digits correct
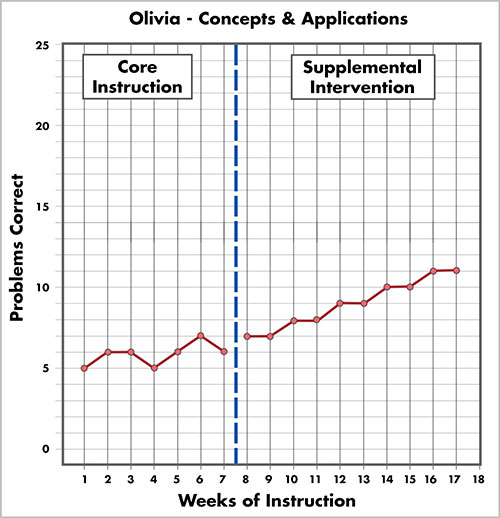
Brand 123 Criteria
Performance level = 20**
Slope greater than .40
Olivia’s Performance:
Performance level = 11
Slope = .44
**Problems correct
Instructional decision: Olivia’s slope, or rate of growth, indicates that she is responding adequately to supplemental intervention. However, because her performance level has not reached the desired level of 20 digits, or problems correct, it was decided that she should receive another round of Tier 2 intervention.
(Close this panel)
Jacob’s Tier 2 Data
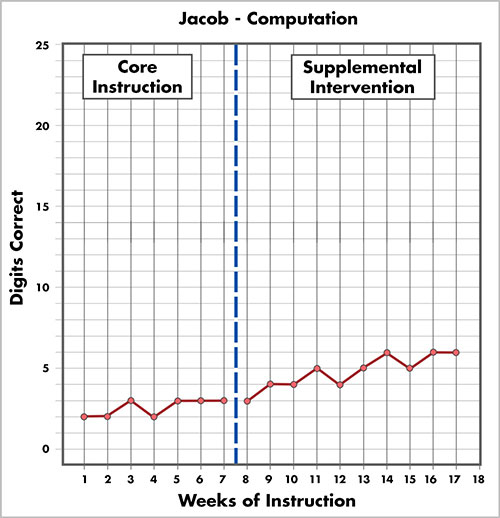
Brand 123 Criteria
Performance level = 20*
Slope greater than .40
Jacob’s Performance:
Performance level = 6
Slope = .33
*Digits correct
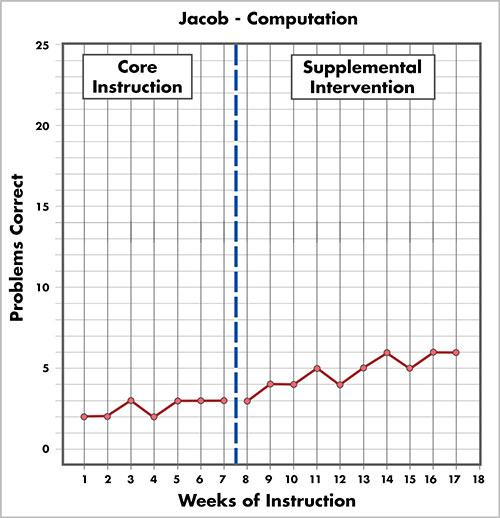
Brand 123 Criteria
Performance level = 20**
Slope greater than .40
Jacob’s Performance:
Performance level = 7
Slope = .22
**Problems correct
Instructional decision: Jacob has not responded adequately to several types of supplemental interventions. He will be referred for a special education evaluation.
(Close this panel)
Though the Lyle Elementary example highlights the implementation of each key feature of RTI for mathematics, there are many issues school personnel must consider before they begin the implementation process. By planning ahead, school personnel have a greater chance of successfully implementing RTI. Diane Bryant discusses a number of the issues that schools should consider (time: 1:45).
Diane Pedrotty Bryant, PhD
Project Director, Mathematics Institute for
Learning Disabilities and Difficulties
University of Texas at Austin

Transcript: Diane Bryant, PhD
The main advice that I would offer is, beginning of spring, think about allocating time for your intervention. And you really have to designate time for the intervention to be conducted. I think the second idea would be that you need to identify who is going to be conducting the intervention. I think support for classroom teachers, especially teachers who may not have as much math ed background, is critical. I think that PD and then coaching are really critical pieces. And modeling for teachers, helping them to learn the intervention. I think that it’s important for schools to have identified their measures and to ensure that teachers are comfortable administering these measures. If teachers are going to be responsible for scoring the measures then that has to be a piece that’s considered in terms of how that’s going to actually happen. Whether it’s groups of teachers do the scoring or there is another person designated for doing the scoring, that’s a really important piece that has to be thought of ahead of time. What do you do with all the data? That’s a piece that needs to be factored in to your plan, and then what do the data mean? How do you use the data? How are you going to make decisions about grouping students? I think that the fidelity piece is crucial, and certainly important would be the instructional leadership. Principals need to have a real good understanding of what RTI is about and how to support their staff in accomplishing the process that’s in their school and that’s been adopted by their school district.