MTSS/RTI: Mathematics
Assessment
Take some time now to answer the following questions. Please note that the IRIS Center does not collect your Assessment responses. If this is a course assignment, turn it in using your professor’s preferred method. If you have trouble answering any of the questions, go back and review the Perspectives & Resources pages in this module.
- List and describe the six main features of RTI.
- What are the two types of assessment used in RTI? Briefly describe the purpose of each.
 Imagine you are a second-grade mathematics teacher. You have just administered a CBM computation probe to your class for Week 4. Before you can determine whether Bob is making adequate progress, you need to:
- Determine Bob’s score using digits correct
- Graph this score along with Bob’s data for the last three weeks
- Calculate Bob’s performance level
- Calculate Bob’s rate of growth
Bob
-
- Determine Bob’s score for digits correct in week 4.
- On the graph below, plot this score along with Bob’s data for the last three weeks (scroll down to see graph).
-
- Calculate Bob’s performance level.
-
- Calculate Bob’s rate of growth.
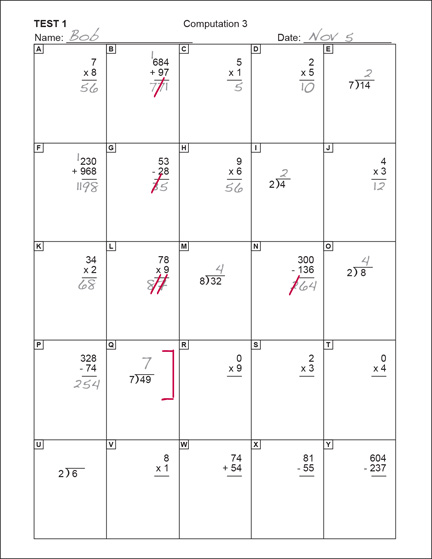
Description of Computation Probe
This is a scored mathematics computation probe featuring addition and subtraction of two- and three-digit numbers, as well as multiplication and division of one- and two-digit numbers. Bob completed Questions A through Q, as indicated by the bracket at the end of Question Q. Below are the results for each problem Bob attempted.
A: 2 digits correct
B: 2 out of three digits correct (the incorrect digit is noted by a pen slash)
C: 1 digit correct
D: 2 digits correct
E: 1 digit correct
F: 4 digits correct
G: 1 out of two digits correct (the incorrect digit is noted by a pen slash)
H: 2 digits correct
I: 1 digit correct
J: 2 digits correct
K: 2 digits correct
L: 0 out of 2 digits correct (the incorrect digits are noted by pen slashes)
M: 1 digit correct
N: 2 out of 3 digits correct (the incorrect digit is noted by pen slashes)
O: 1 digit correct
P: 3 digits correct
Q: 1 digit correct
Week 2=24
Week 3=23
Week 4=
(Close this panel)
- Below are links to progress monitoring criteria and graphs for three students. Review each student’s graph. Based on the data:
- Calculate the student’s performance level.
- Calculate the student’s rate of growth.
- Make an instructional decision and explain your answer.
Student 1
CBM Criteria
Slope: greater than 0.40
Benchmark: 15
![]() Remember to use the slope calculator.
Remember to use the slope calculator.
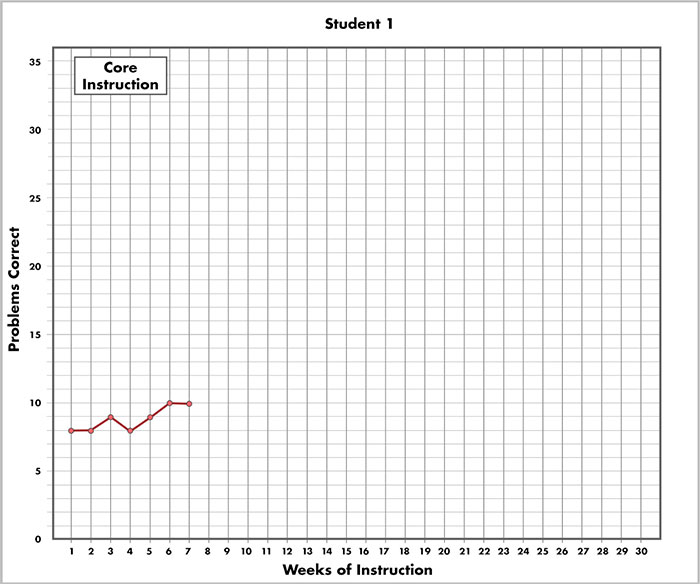
This graph is titled “Student 1.” The x-axis is labeled “Weeks of Instruction” and each week from 0 to 30 is labeled on the axis. The y-axis is labeled “Problems Correct.” This axis is labeled from 0 to 35, with every fifth number delineated numerically and with five tick marks between each label, representing 1 problem correct each. The portion of the graph from Week 1 to 7 is labeled Core Instruction. There are seven red plot points within this week span, from 8 to 10 problems correct.These points connect to form a red line graph and represent the student’s data for core instruction.
Student 2
CBM Criteria
Slope: greater than 0.40
Benchmark: 25
![]() Remember to use the slope calculator.
Remember to use the slope calculator.
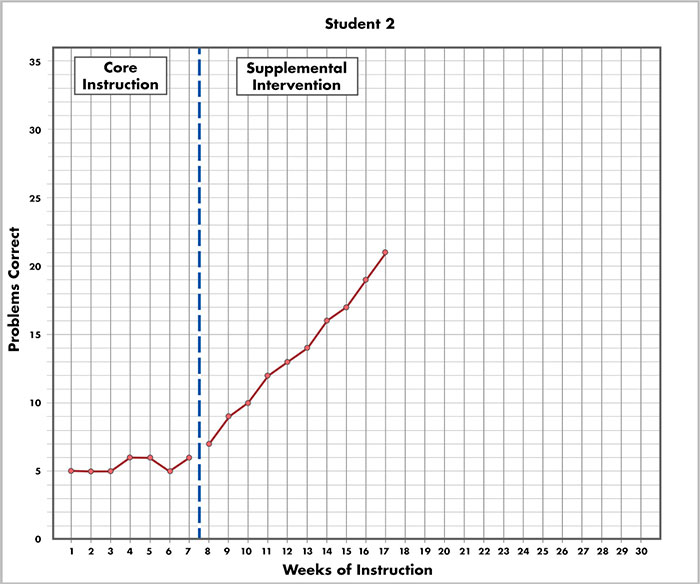
This graph is titled “Student 2.” The x-axis is labeled “Weeks of Instruction” and each week from 0 to 30 is labeled on the axis. The y-axis is labeled “Problems Correct.” This axis is labeled from 0 to 35, with every fifth number delineated numerically and with five tick marks between each label, representing 1 problem correct each. The portion of the graph from Week 1 to 7 is labeled “Core Instruction.” The portion of the graph from week 8 to week 17 is labeled “Supplemental Intervention.” There is a vertical black-dashed line separating these two portions of the graph. There are seven red plot points in the Core Instruction portion, from 5 to 6 problems correct. These points connect to form a red line graph and represent the student’s data for core instruction. The red plot points continue in the Supplemental Intervention portion, from 7 to 21 problems correct. These points connect to form a red line graph and represent the student’s data for supplemental intervention.
Student 3
CBM Criteria
Slope: greater than 0.40
Benchmark: 30
![]() Remember to use the slope calculator.
Remember to use the slope calculator.
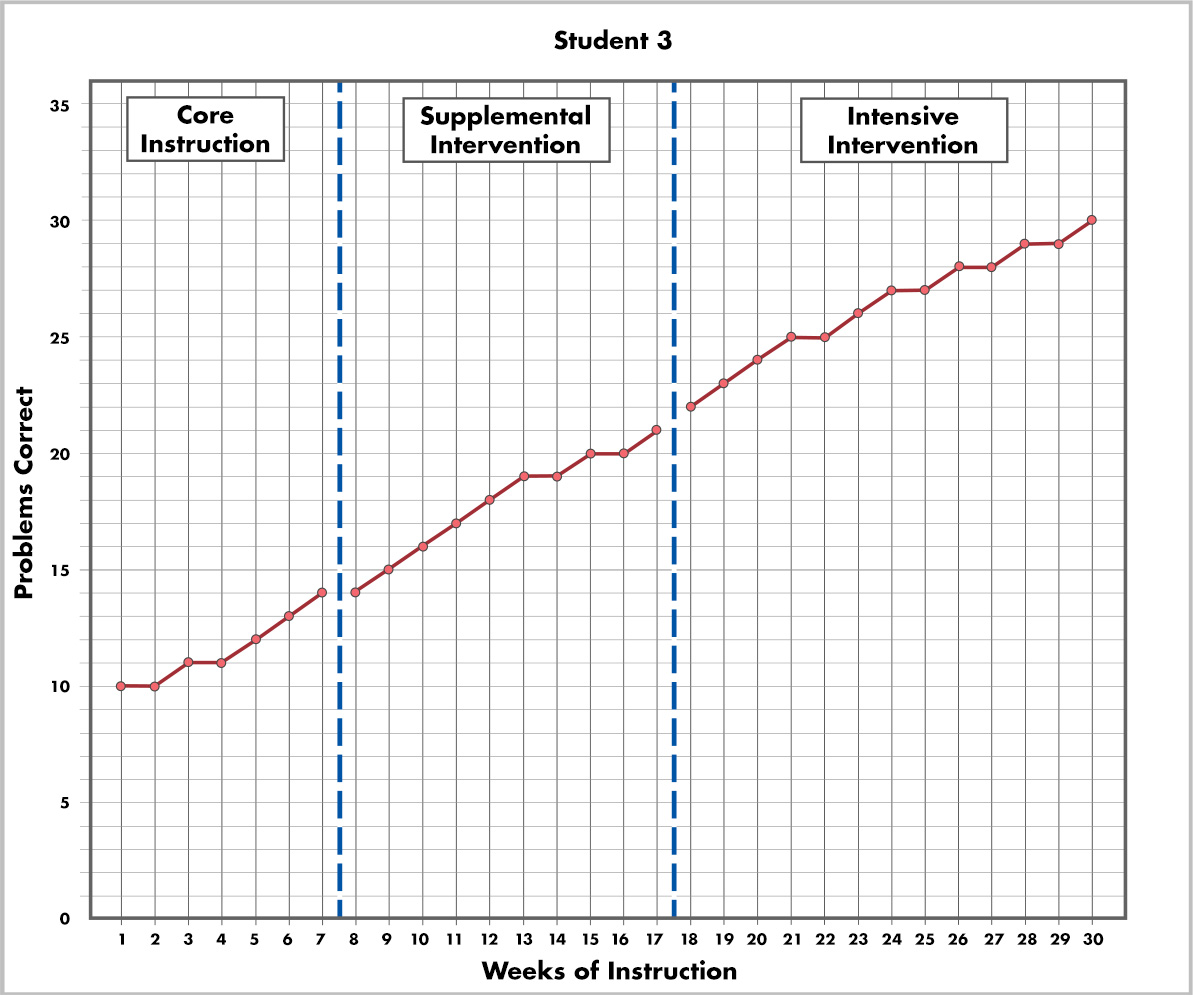
This graph is titled “Student 3.” The x-axis is labeled “Weeks of Instruction” and each week from 0 to 30 is labeled on the axis. The y-axis is labeled “Problems Correct.” This axis is labeled from 0 to 35, with every fifth number delineated numerically and with five tick marks between each label, representing 1 problem correct each. The portion of the graph from Week 1 to 7 is labeled “Core Instruction.” The portion of the graph from Week 8 to 17 is labeled “Supplemental Intervention.” The portion of the graph from Week 18 to 30 is labeled “Intensive Intervention.” There are two vertical black-dashed lines separating these three portions of the graph. There are seven red plot points in the Core Instruction portion, from 10 to 14 problems correct. These points connect to form a red line graph, which represents the student’s data for core instruction. There are ten red plot points in the Supplemental Intervention portion, from 14 to 21 problems correct. These points connect to form a red line graph,which represents the student’s data for supplemental intervention. There are thirteen points in the Intensive Intervention portion, from 22 to 30 problems correct. These points connect to form a red line graph, which represents the student’s data for intensive intervention.
- How can school personnel monitor fidelity of implementation of the main RTI components? How can they respond if a teacher is not implementing with fidelity?