What is RTI for mathematics?
Page 6: Evaluating Student Performance
 As we have explained, one of the purposes of RTI is to determine whether students are responding to the instruction they receive; in other words, whether or not they are learning the instructional content. To accomplish this task, teachers can examine the progress monitoring data they have collected with special focus on two indicators: rate of growth and performance level. We’ll look at each of these in more detail below.
Rate of Growth
Rate of growth refers to the average growth of a student’s mathematics skills over a period of time and is represented by the slope of that student’s graphed scores (i.e., direction and steepness of the line connecting the graphed scores). Once a student’s scores are plotted for a minimum of five weeks, her slope can be determined with a simple calculation using the following pieces of information: the score on the first probe, the score on the last probe, the first administration (e.g., week 1), and the last administration (e.g., week 6).
Teachers can calculate a student’s rate of growth by entering this information into the user-friendly
IRIS Slope Calculator![]() . Alternatively, they can quickly determine a student’s rate of growth using a simple calculation described in the example below.
. Alternatively, they can quickly determine a student’s rate of growth using a simple calculation described in the example below.
Example:
| Score on first probe: 12 | Score on second probe: 20 |
| First administration: Week 1 | Second administration: Week 8 |
| Step 1: Subtract the score on the first probe from the score on the last probe. | |
| Step 2: Subtract the week number of the first administration from the week of the last administration. | |
| Step 3: Divide the result of Step 1 by the result of Step 2. | |
| The student’s rate of growth (or slope) is 1.14. | |
Each progress monitoring measure specifies the rate of growth that indicates an adequate response to intervention for that measure. These criteria differ for each type of probe and for each grade level. The teacher should compare each student’s rate of growth to that specified by the relevant progress monitoring measure to determine if the student is:
- Responding adequately to instruction — The student’s rate is equal to or greater than the specified rate of growth.
- Not responding adequately to instruction — The student’s rate is less than the specified rate of growth, indicating that the student needs more intensive intervention.
In the example above, the student’s rate of growth was 1.14 digits or problems correct per week, depending on how the teacher is scoring the probe (e.g., digits correct, problems correct). The teacher will compare this number to the established criterion to determine whether this is an adequate rate of growth.
For Your Information
When you calculate rate of growth, it is important to be sure to evaluate the appropriate data. For example, in the graph below, if the teacher calculates the student’s rate of growth for supplemental intervention, she would only use information pertaining to the supplemental intervention. Therefore, she would use 17 as the score on the first probe (not 11, which is the student’s score on the first probe for core instruction). Similarly, she would use Week 7 for the first administration and 12 for the last administration.
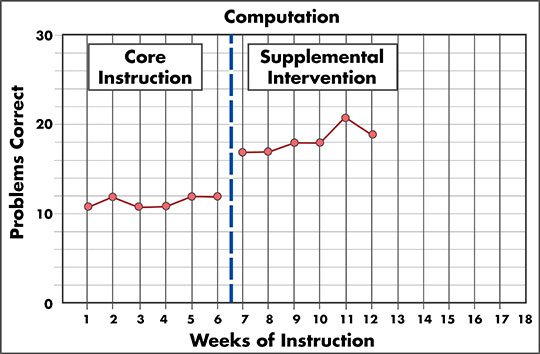
This graph is titled Computation. The x-axis is labeled “Weeks of Instruction” and each week from 0 to 18 is labeled on the axis. The y-axis is labeled “Problems Correct.” This axis is labeled from 0 to 30, with 10, 20, and 30 delineated numerically with five tick marks between each label, representing 2 digits correct each. The graph itself is divided into two portions by a dashed black line between weeks 6 and 7. The first portion of the graph is labeled “Core Instruction” and the second portion is labeled “Supplemental Intervention.” There is a separate red line graph in each portion of the graph. In the Core Instruction portion, six points are plotted all around 11 to 12 problems correct. In the Supplemental Intervention portion, six points are plotted from around 17 to 21 problems correct. The last plotted point in the Supplemental Intervention portion of the graph is at Week 12.
Activity
It’s time to practice. Examine the graph for one of the students below. Calculate the student’s slope and evaluate his or her rate of growth.
Activity: Calculate Rate of Growth (Student A: Elementary)
Calculate the slope of your student’s CBM scores over the seven-week monitoring period. Look at his graph to find the information you need.
![]() Enter the information in the slope calculator
Enter the information in the slope calculator
Enter the slope here:
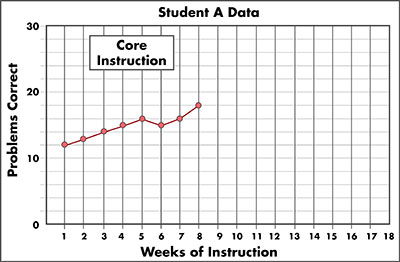
This graph is titled “Student A Data.” The x-axis is labeled “Weeks of Instruction,” and each week from 1 to 18 is labeled on the axis. The y-axis is labeled “Problems Correct.” This axis is labeled from 0 to 30, with 10, 20, and 30 delineated numerically with five tick marks between each label, representing 2 digits correct each. The lines indicating 0, 10, 20, and 30 problems correct are labeled. There is a box in the upper-left corner labeled “Core Instruction.” There are data points for weeks 1 through 8 at 12, 13, 14, 15, 16, 15, 16, and 18 problems correct, respectively. These points connect to form a red line graph.
Activity: Calculate Rate of Growth (Student B: Secondary)
Calculate the slope of your student’s CBM scores over the seven-week monitoring period. Look at his graph to find the information you need.
![]() Enter the information in the slope calculator
Enter the information in the slope calculator
Enter the slope here:
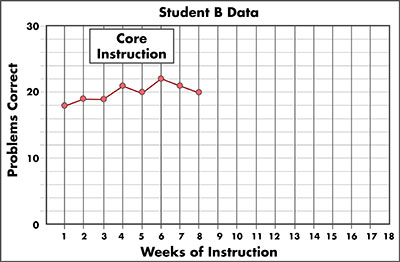
This graph is titled “Student B Data.” The x-axis is labeled “Weeks of Instruction,” and each week from 1 to 18 is labeled on the axis. The y-axis is labeled “Problems Correct.” This axis is labeled from 0 to 30, with 10, 20, and 30,delineated numerically with five tick marks between each label, representing 2 digits correct each. The lines indicating 0, 10, 20, and 30 problems correct are labeled. There is a box in the upper-left corner labeled “Core Instruction.” There are data points for weeks 1 through 8 at 18, 19, 19, 21, 20, 22, 21, and 20 problems correct, respectively. These points connect to form a red line graph.
Performance Level
Performance level is an indication of a student’s current level of mathematics skills, often denoted by a score on a test or probe. It is usually represented on the vertical axis (or y-axis) on a graph of the student’s scores. To calculate performance level, the teacher examines each student’s graph and calculates the student’s average score on the two most recent probes.
Once the teacher has determined the student’s performance level, she will compare it to a benchmark (or goal), which will vary depending on the measure and the grade level. By doing so, the teacher can determine whether the student is:
- Responding adequately to instruction — The student’s performance level is equal to or greater than the benchmark.
- Not responding adequately to instruction — The student’s performance level is less than the specified benchmark, which indicates that the student needs more intensive intervention.
Example:
In the graph to the right, the student’s two most recent probes are 17 and 16, respectively. The average of these two scores (i.e., [17+16] ÷ 2) is 16.5, or 17 if rounded. If the 3rd-grade benchmark is 10 and the student’s level of performance is 16.5, this indicates that the student is responding adequately to instruction.
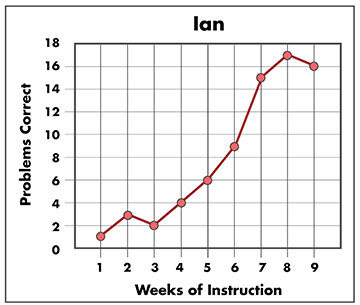
This graph illustrates Ian’s performance level over nine weeks of instruction. The y-axis is labeled “Problems Correct” and is numbered 0–18. The x-axis is labeled “Weeks of Instruction” and is numbered 1–9. Ian’s progress over the nine weeks is as follows: Week 1, 1 problem correct; Week 2, 3 problems correct; Week 3, 2 problems correct; Week 4, 4 problems correct; Week 5, 6 problems correct; Week 6, 9 problems correct; Week 7, 15 problems correct; Week 8, 17 problems correct; and Week 9, 16 problems correct. The data points are connected by a line.
Activity
It’s time to practice. Examine the graph for one of the students below. Calculate his or her performance level and determine whether he has met the benchmark.
Activity: Calculate Performance Level (Student A: Elementary)
Compute your student’s current performance level. Examine his graph and calculate the average of his last two probes.
Enter the average of his last two probes here:
compareTEXT
This graph is titled “Student A Data.” The x-axis is labeled “Weeks of Instruction” and each week from 1 to 18 is labeled on the axis. The y-axis is labeled “Problems Correct.” This axis is labeled from 0 to 30, with 10, 20, and 30 delineated numerically with five tick marks between each label, representing 2 digits correct each. The lines indicating 0, 10, 20, and 30 problems correct are labeled. There is a box in the upper left corner labeled “Core Instruction.” There are data points for weeks 1 through 8 at 12, 13, 14, 15, 16, 15, 16, and 18 problems correct, respectively. These points connect to form a red line graph.
Activity: Calculate Performance Level (Student B: Secondary)
Compute your student’s current performance level. Examine his graph and calculate the average of his last two probes.
Enter the average of his last two probes here:
now_compareTEXT
This graph is titled “Student B Data.” The x-axis is labeled “Weeks of Instruction,” and each week from 1 to 18 is labeled on the axis. The y-axis is labeled “Problems Correct.” This axis is labeled from 0 to 30, with 10, 20, and 30 delineated numerically with five tick marks between each label, representing 2 digits correct each. The lines indicating 0, 10, 20, and 30 problems correct are labeled. There is a box in the upper-left corner labeled “Core Instruction.” There are data points for weeks 1 through 8 at 18, 19, 19, 21, 20, 22, 21, and 20 problems correct, respectively. These points connect to form a red line graph.
For Your Information
Progress monitoring probes often provide end-of-year goals but do not provide interim goals. Under some circumstances, it might be necessary or beneficial for teachers to identify a short-term goal for individual students.
- If a teacher chooses to monitor the progress of all the students in the class, she might find it helpful to compute short-term goals for the students to help them gauge whether they are on track to meet their end-of-year goals and to help them remain motivated to improve their performance.
- Teachers providing individualized, intensive interventions use progress monitoring to determine whether the instructional approach they are using is effective. Using short-term goals might help teachers to more quickly gauge students’ progress and to change their instruction to make it more effective.
To identify short-term goals for the students in your class, click to access the user-friendly
IRIS Short-Term Goal Calculator![]() .
.
Alternatively, teachers can learn the process for determining a short-term goal by clicking the link below.
To determine the short-term goal, the teacher will need to know the following information:
- End-of-year benchmark
- Student’s average score on the first three probes
- Number of weeks left in the school year
- Number of weeks of monitoring
The table below contains step-by-step directions for calculating a short-term goal.
| Calculation Directions | Example | |
| Step 1 | Determine the minimum number of problems or digits correct that the student needs to gain across the year. |
Example: |
| Step 2 | Determine the number of weeks left in the school year. | Example: |
| Step 3 | Determine the minimum number of problems or digits correct that the student needs to achieve each week in order to meet the end-of-year benchmark. |
Take the minimum number problems or digits correct that the student needs to gain across the year and divide it by the number of weeks left in the school year. Example: |
| Step 4 | Determine the short-term gain, meaning how many more digits correct the student needs to be getting at the end of the monitoring period. |
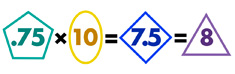
Multiply the weekly gain (.75) by the number of weeks the student is monitored (e.g., 10). This process indicates the number of problems or digits correct the student needs to gain by the end of the monitoring period. Example: |
| Step 5 | Determine the short-term goal. |
Add the short-term gain (8) to the student’s initial score (12 digits). Example: |


Dual Discrepancy
When evaluating a student’s response to core instruction, teachers can use either the performance level or rate of growth as an indicator of adequate performance. However, research indicates that using both criteria at the secondary and tertiary levels offers a better picture of how students are responding to instruction. The use of performance level and rate of growth to evaluate student progress is referred to as the dual discrepancy approach. When teachers use this approach, they can infer that students are:
- Making adequate progress if their scores are at or above the established criterion for either performance level OR rate of growth
- Not making adequate progress if their scores fall below the criteria for both performance level AND rate of growth
The requirement that students’ scores must fall below the criteria for both performance level and rate of growth prevents the over-identification of students in need of additional supports. The table below illustrates how the dual discrepancy approach is used to determine whether a student is responding adequately to instruction.
|
Meets |
Performance Level | Rate of Growth | Outcome |
| Yes | Yes | Making adequate progress | |
| Yes | No | Making adequate progress | |
| No | Yes | Making adequate progress | |
| No | No | Not making adequate progress; needs more intensive services |
Lynn Fuchs outlines how to determine whether a student is making adequate progress in terms of performance level and rate of growth and how that determination applies to changing a student’s tier of instruction (time: 3:17).

Lynn Fuchs, PhD
Dunn Family Chair in Psychoeducational Assessment
Department of Special Education
Vanderbilt University
Transcript: Lynn Fuchs, PhD
The best thinking about how to make decisions about whether students stay in intervention, move to a less-intensive level of intervention, or move to a more-intensive level of intervention are based first of all on performance level at the end of intervention. And for that we need a normative framework to index how the student compares to the peers either in the classroom or across his grade level in that school. And for that we have to rely on the kind of periodic, intermittent assessment that the school collects for everybody in the school. If a student is at least at the twenty-fifth percentile of his classroom peers, it would make sense to release him from intervention, continue to monitor his performance, and see whether he continues to grow without the more-intensive intervention he’s been getting.
For a student who is not at least at the twenty-fifth percentile of his local comparison group, the likelihood that he can succeed back in the classroom goes down. And so we would consider two options for that student: either continuing in Tier 2 or moving to more-intensive intervention. And one guideline for deciding whether to keep him in Tier 2 or move him to more intensive is his rate of progress during the intervention he’s presently receiving. For that, we would want to use weekly or every other week data from the Tier 2 intervention to calculate a rate of improvement. That’s his rate of progress. How much is he increasing on a weekly basis in his present Tier 2 intervention. There are norms for most commercially available progress monitoring systems that will tell you what an adequate rate of growth for that progress monitoring measure is. And if the student is demonstrating a good rate of progress, even though he’s not at the twenty-fifth percentile yet of his classroom peers, then a good decision is to keep the student in his present intervention. But if this student meets the dual discrepancy–that is, he’s low on performance at the end of intervention–and his rate of growth in his present level of intervention is inadequate then the right decision is to move this student to a more-intensive level of intervention.
When To Use Each Indicator
Depending on the level of support students are receiving, teachers should evaluate their progress using either rate of growth, performance level, or both. Additionally, the timing of evaluation is dependent on the level of support the students receive.
| Level of Support | Indicator(s) | When to Evaluate |
| Tier 1 | Rate of growth OR performance level | After the end of monitoring period (e.g., 5 to 10 weeks) |
| Tier 2 | Dual discrepancy | At end of Tier 2 intervention (e.g., 10 to 12 weeks) |
| Tier 3 | Dual discrepancy | After 6 data points have been collected |
Activity
Now imagine you are providing Tier 2 intervention to a group of students. Apply the dual discrepancy approach to determine whether your students are making adequate progress in the intervention.
Activity: Dual Discrepancy Approach
The table below contains data about the students in your Tier 2 intervention group. Using the dual discrepancy approach, determine which students are making adequate progress. Below are the criteria the students must meet or exceed.
Rate of Growth: .40
Benchmark: 20
| Rate of Growth | Performance Level | Is the student making adequate progress? | |
|---|---|---|---|
| Student 1 | .5 | 21 | |
| Student 2 | .6 | 15.5 | |
| Student 3 | .3 | 10.5 | |
| Student 4 | .3 | 21.5 |