What is RTI for mathematics?
Page 7: Data-Based Decisions
Data-based decision making is the process of using data (e.g., progress monitoring data) to make instructional decisions, such as which students are struggling with mathematics and which level of instructional support would best meet those students’ academic needs. After evaluating a student’s rate of growth or performance level, the teacher or team of teachers use this information to make informed instructional decisions. School personnel need to use a standard procedure to determine whether to initiate or discontinue additional instructional supports.
Initiating Instructional Supports
The process of initiating instructional supports often begins with a universal screening. At each subsequent level of instruction, progress monitoring data is collected to determine the progress of struggling students. The graphic below illustrates the decision-making process for initiating instructional supports.
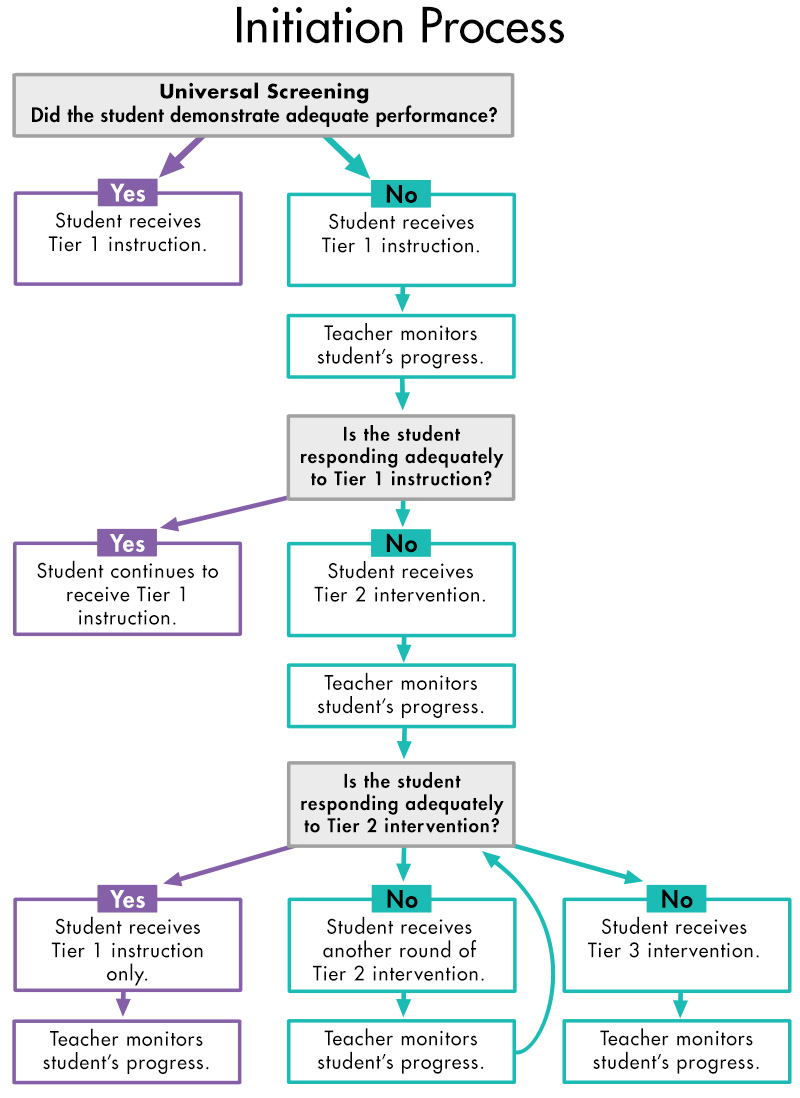
If a student demonstrates adequate performance during universal screening, they receive Tier 1 instruction. If a student does not demonstrate adequate performance during universal screening, they receive Tier 1 instruction and the teacher monitors their progress. If the student responds adequately to Tier 1 instruction, they continue to receive this instruction and the teacher monitors their progress. If the student responds inadequately to Tier 1 instruction, they receive Tier 2 or 3 intervention and the teacher monitors their progress.
Note: Even though the RTI process can be used to help identify students with learning disabilities who may be eligible for special education services, a student may be referred for a special education evaluation at any point.
Discontinuing Instructional Supports
The same progress monitoring data can also be used to determine whether the teacher needs to make an instructional change: discontinuing a given level of instruction, receiving another round of intervention, or receiving more intensive instruction. The graphic below illustrates the decision-making process for discontinuing instructional supports.
round of intervention
glossary
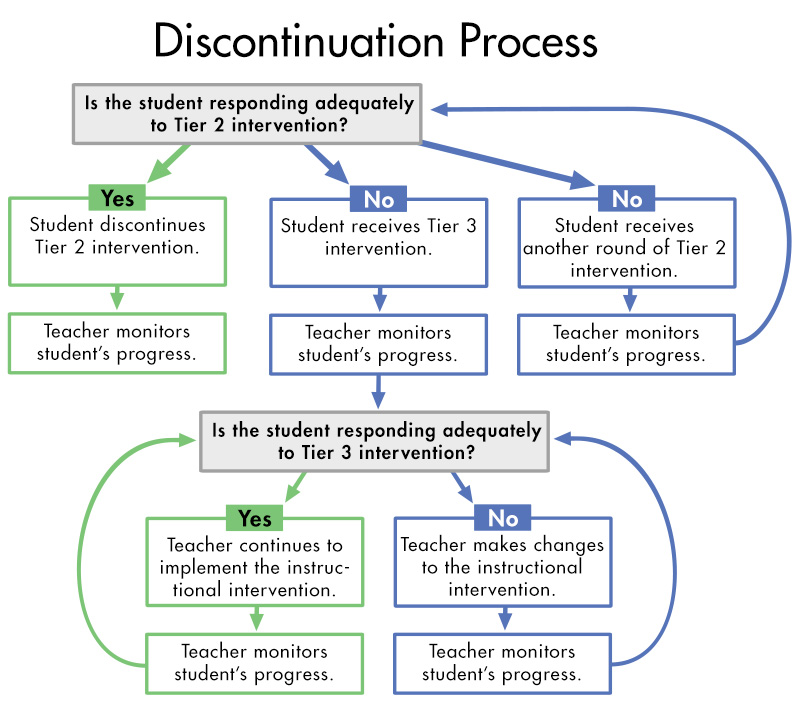
If a student responds adequately to Tier 2 intervention, they discontinue the intervention and the teacher monitors their progress. If a student responds inadequately to Tier 2 intervention, they either receive Tier 3 intervention while the teacher monitors their progress or continue this intervention while the teacher further monitors their progress. If a student responds adequately to Tier 3 intervention, the teacher continues implementing the instructional intervention and monitors the student’s progress. If a student responds inadequately to Tier 3 intervention, the teacher makes changes to the instructional intervention and monitors the student’s progress.
Teachers should continue progress monitoring even after a student discontinues an intervention. In this way, teachers can catch a student who is beginning to fall behind before the next universal screening, and a decision can be made about providing additional support either at the primary or secondary levels.
When teachers implement the discontinuation process, it is important that they ensure that instructional support is not ended prematurely because the student appears to have acquired the necessary skills. In other words, school personnel need to be sure that a student has mastered and can maintain the skills acquired during intervention before that intervention is discontinued. Discontinuing any level of support too soon can result in students bouncing back and forth between levels (i.e., “ping-ponging”). For example, a student who discontinues Tier 2 intervention without mastering requisite skills will soon begin to fall behind when receiving core instruction only. This, in turn, will result in the student’s again needing Tier 2 supports.
For Your Information
If a student does not respond adequately to Tier 2 intervention and if Tier 3 intervention at that school is provided through special education, the student must go through the special education eligibility determination process. If a student responds adequately to Tier 3 intervention and it is determined that the student no longer needs these services, an individualized education program (IEP) meeting must be held to discontinue those services.
individualized education program (IEP)
glossary
In the case of a student who is receiving intensive, individualized intervention and whose progress monitoring data indicate that she is not sufficiently responding to the current intervention, the teacher needs to determine:
- Why is the student not responding?
- What type of change needs to be made to the intervention?
To determine a student’s specific instructional needs and to make intervention adaptations that align with those needs, the teacher can use a diagnostic assessment—a tool that teachers can use to collect information about a student’s strengths and weaknesses in a skill area. These assessments can be formal (e.g., standardized achievement test) or informal (e.g., work samples).
To learn more about how to use assessment data to intensify instruction, view the following IRIS Module:
The following examples demonstrate how to use progress monitoring data to make informed instructional decisions. In this case, the criteria that indicate adequate response to intervention are:
Performance Level: 20
Slope: 0.4
| Data | Instructional Decision |
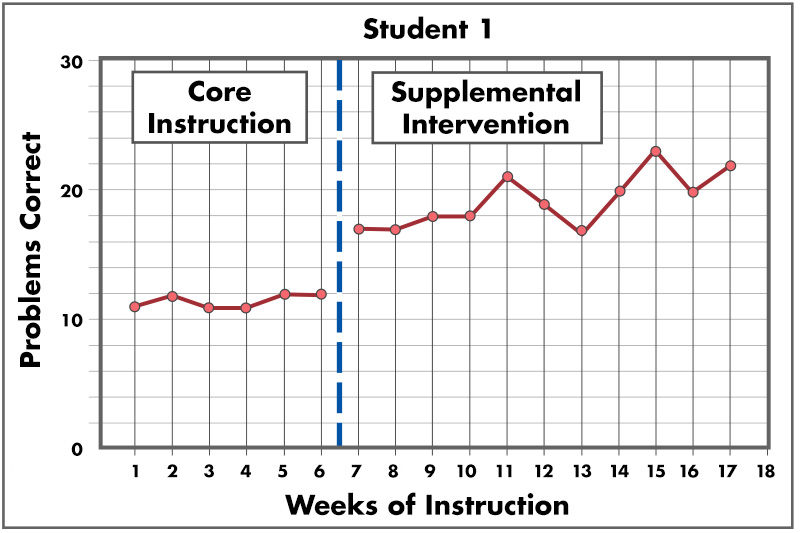 Performance Level = 21 Slope = .5
|
Student 1’s data indicate that he has exceeded criteria for performance level and slope, therefore the team decides the student needs to:
|
|
This graph is titled Student 1. The x-axis is labeled “Weeks of Instruction” and each week from 0 to 18 is labeled on the axis. The y-axis is labeled “Problems Correct.” This axis is labeled from 0 to 30, with 10, 20, and 30, delineated numerically with five tick marks between each label, representing 2 digits correct each. The graph itself is divided into two portions by a dashed black line between weeks 6 and 7. The first portion of the graph is labeled “Core Instruction” and the second portion is labeled “Supplemental Intervention.” There is a separate red line graph in each portion of the graph. In the Core Instruction portion, six points are plotted all around 11 to 12 digits correct. In the Supplemental Intervention portion, eleven points are plotted from around 17 to 23 digits correct. This graphic is more variable, with steep up and down slopes, than the graph in the Core Instruction portion. The last plotted point in the Supplemental Intervention portion of the graph is Week 17. |
|
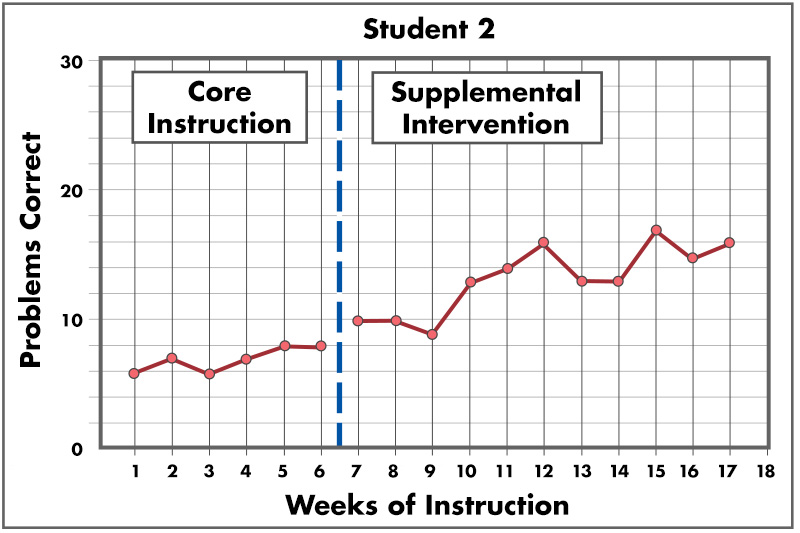 Performance Level = 15.5 Slope = .6
|
Student 2’s data indicate that he has not met the criteria for performance level but has exceeded the criteria for slope, therefore the team decides the student needs to:
|
|
This graph is titled Student 2. The x-axis is labeled “Weeks of Instruction” and each week from 0 to 18 is labeled on the axis. The y-axis is labeled “Problems Correct.” This axis is labeled from 0 to 30, with 10, 20, and 30, delineated numerically with five tick marks between each label, representing 2 digits correct each. The graph itself is divided into two portions by a dashed black line between weeks 6 and 7. The first portion of the graph is labeled “Core Instruction” and the second portion is labeled “Supplemental Intervention.” There is a separate red line graph in each portion of the graph. In the Core Instruction portion, six points are plotted all around 6 to 8 digits correct. In the Supplemental Intervention portion, eleven points are plotted from around 8 to 17 digits correct. This graphic is more variable, with steep up and down slopes, than the graph in the Core Instruction portion. The last plotted point in the Supplemental Intervention portion of the graph is Week 17. |
|
*Note: According to the dual discrepancy approach, this student is responding adequately to intervention. The team in some schools might decide that he can discontinue Tier 2 intervention and receive Tier 1 instruction only. However, the team at this school decides that he would benefit from another round of Tier 2 intervention to increase his performance level.
Listen as Diane Bryant describes how teams make decisions in cases similar to that of Student 2’s by carefully considering a student’s data (time: 0:32).
Diane Pedrotty Bryant, PhD
Project Director, Mathematics Institute for
Learning Disabilities and Difficulties
University of Texas at Austin

Transcript: Diane Bryant, PhD
There are multiple dynamics in terms of the data, so you may have the adequate slope but the performance level is still not commensurate with typical performance. Another dose of supplemental intervention is probably warranted. For those youngsters who do qualify to exit because they perform above a cut score, we might be closing the gap but not sufficiently where you would necessarily exit a student from intervention.
Activity
Imagine you are providing Tier 2 intervention to a small group of students. In the demonstration above, Student 1 and Student 2’s progress monitoring data were examined and instructional decisions were made. Following the same procedures, make instructional decisions for the remaining students in your group. Click on each to make an instructional decision for that student.
| Student 3 | Student 4 |
Activity: Student 3
Computation Criteria
- Benchmark: 20
- Slope: 0.40
Student 3’s Data
- Performance Level = 10.5
- Slope = 0.30
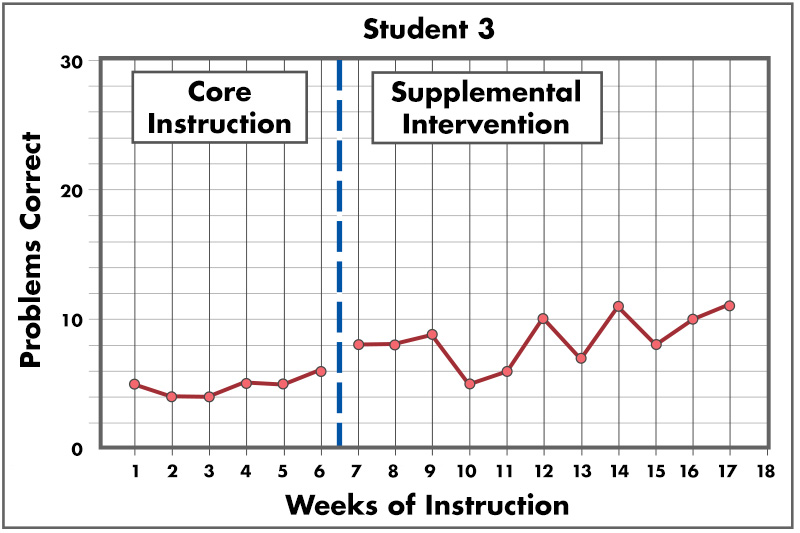
- Has the student met her benchmark?
- Is the student’s rate of growth adequate?
- Is the student responding adequately to supplemental intervention?
Activity: Student 4
Computation Criteria
- Benchmark: 20
- Slope: 0.40
Student 4’s Data
- Performance Level = 21.5
- Slope = 0.30
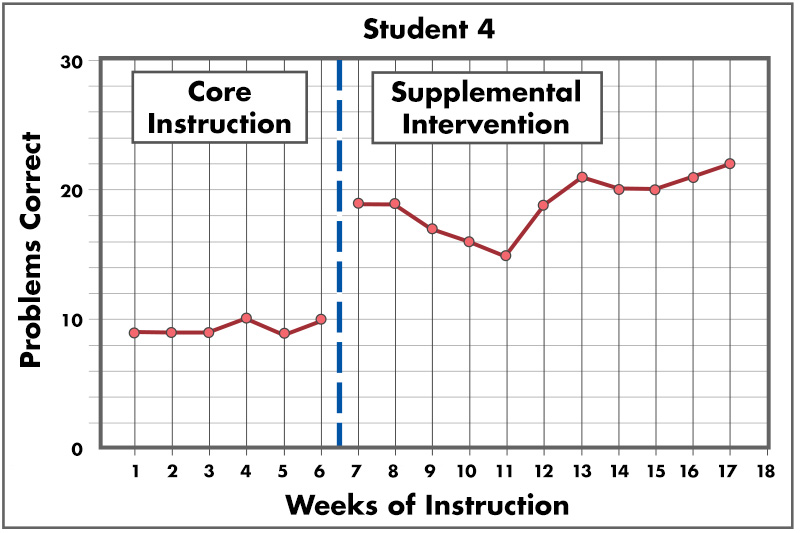
- Has the student met his benchmark?
- Is the student’s rate of growth adequate?
- Is the student responding adequately to supplemental intervention?