How can Ms. Flores and Mr. Ericson use the school summary data to guide their efforts to help improve the scores of students with disabilities?
Page 4: Compare Data
An important part of interpreting data is to determine the relative effectiveness of school improvement efforts by comparing scores. A school attempting to raise math scores among its students with disabilities will find that there are several methods of comparing those scores at the basic level of performance.
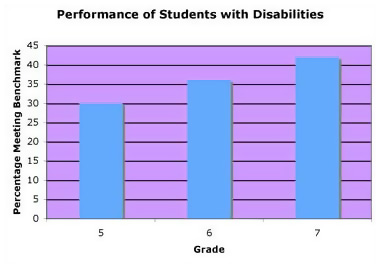
Several Grades in a Single Year
A school principal may wish to gauge what percentage of students with disabilities at each grade level is performing to the corresponding benchmark. In the graph to the right, 30% of fifth graders, 36% of sixth graders, and 42% of seventh graders are meeting the benchmark.

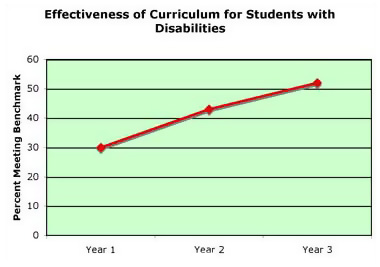
Single Grade Across Several Years
A school principal may want to determine whether a newly adopted sixth-grade curriculum is effective. In the graph to the left, 30% of the sixth-grade students met the benchmark for Year 1, 43% for Year 2, and 52% for Year 3.

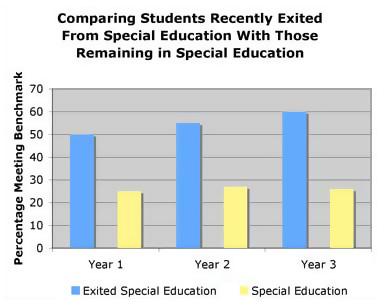
Multiple Groups in Multiple Years
A school principal may want to compare students who have exited from special education within the past school year to those students with disabilities who continue to receive special education services. The graph to the right illustrates that, across three years, students who exited special education have higher scores than those who have remained in special education.

Activity
Find data from a recent assessment in a district other than your own. (This should be available on the Internet.)
- Look at the reporting of scores for students with disabilities. What data are reported? What percentage of the students with disabilities in the district is performing at an acceptable level?
- Now look at data for the same assessment for your district. Regarding students with disabilities, what data are reported? What percentage of the students with disabilities in the district is performing at an acceptable level?
- Now compare the two districts. Is the method for reporting data for students with disabilities different? Does one method seem better to you? If so, why?