• IRIS Center
COVID-19 RESOURCES
Careers at IRIS
  • Resources
    • IRIS Resource Locator
      Modules, case studies, activities, & more
    • Evidence-Based Practice Summaries
      Research annotations
    • High-Leverage Practices
      IRIS resources on HLPs
    • IRIS Alignment Tools
      HLPs, SiMRs, & CEEDAR ICs
    • Films
      Portrayals of people with disabilities
    • Children's Books
      Portrayals of people with disabilities
    • For Faculty
      Sample syllabi, curriculum matrices, & more
    • For PD Providers
      Sample PD activities, planning forms, & more
    • For Independent Learners
      Resources & tools for independent learners
    • Website Navigation Videos
      Getting around our Website & modules
    • New & Coming Soon
      Latest modules & resources
    • Glossary
      Disability related terms
  • PD Options
    • PD Certificates for Educators
      Our certificate, your PD hours
    • School & District Platform
      A powerful tool for school leaders
    • Log in to Your IRIS PD
  • Articles & Reports
    • Articles
      Articles about IRIS use & efficacy
    • Internal IRIS Reports
      Reports on IRIS use & accomplishments
    • External Evaluation Reports
      Evaluations of the IRIS Center
    • Learner Outcomes
      Summaries of module effectiveness
    • Consumer Satisfaction
      Feedback and testimonials from IRIS users
    • IRIS Stories
      Our resources, your stories
    • News & Events
      What, when, & where it's happening
  • About
    • Who We Are
      Our team, experts, & advisors
    • What We Do
      Our resources & process
    • Contact Us
      Get in touch with IRIS
  • Help
    • Help & Support
      Get the full benefit from our resources
    • Website Navigation Videos
      Getting around our Website & modules
  • Module
  • Challenge
  • Initial Thoughts
  • Perspectives & Resources
  • Wrap Up
  • Assessment
Challenge
Initial Thoughts
Perspectives & Resources

What is data-based individualization?

  • Page 1: Overview of Data-Based Individualization

How can school personnel use data to make instructional decisions?

  • Page 2: Collecting and Evaluating Data
  • Page 3: Progress Monitoring
  • Page 4: Analyzing Progress Monitoring Data
  • Page 5: Diagnostic Assessment
  • Page 6: Error Analysis for Reading
  • Page 7: Error Analysis for Mathematics
  • Page 8: Making Data-Based Instructional Decisions for Reading
  • Page 9: Making Data-Based Instructional Decisions for Mathematics

Resources

  • Page 10: References & Additional Resources
  • Page 11: Credits
Wrap Up
Assessment
We want to hear from you. Please complete our brief Module Feedback Form.

Intensive Intervention (Part 2): Collecting and Analyzing Data for Data-Based Individualization

Assessment

  1. Describe why collecting data is essential in the DBI process. Be sure to mention the two types of data that should be collected.
  2. Explain the importance of conducting error analyses of students’ data or work samples. Be sure to include the types of information that you can obtain.
  3. Noah is a third-grade student who has severe and persistent difficulties in reading. He receives intensive, individualized instruction (Tier 3).
    1. Below is a graph of his progress monitoring data for the last eight weeks. View the graph and note whether Noah is responding to the intervention.
    2. Describe what the data pattern suggests (i.e., factors that might be contributing to his performance).
      assessment_graph_web

      Description

      This chart represents Noah’s progress monitoring data. The x-axis is labeled “Weeks” and numbered from 1 to 11 in one-week increments. The y-axis is labeled “Words Read Correctly” and is numbered 0 to 14 in step-word increments. A vertical black dotted line divides the graph at between Weeks 3 and 4. The left side of his divide is labeled “Baseline Data,” while the right side is labeled “Progress Monitoring Data.” Noah’s red goal line begins at Week 3 and indicates the following goals for his reading: 3 words per minute in Week 3, just below 4 words per minute in Week 4, just above 4 words per minute in Week 5, 5 words per minute in Week 6, 6 words per minute in Week 7, just below 6.5 words per minute in Week 8, just above 7 words per minute in Week 9, 8 words per minute in Week 10, and 8.5 words per minute in Week 11.

      Noah’s blue data line suggests the following correct responses per minute: 2 words per minute in Week 1, 7 words per minute in Week 2, 3 words per minute in Week 3, 10 words per minute in Week 4, 4 words per minute in Week 5, 1 word per minute in Week 6, 3 words per minute in Week 7, 8 words per minute in Week 8, 2 words per minute in Week 9, 7 words per minute in Week 10, and 5 words per minute in Week 11.

    3. Next, conduct an error analysis of Noah’s passage reading fluency probe using the attached error analysis form.
      Click here and print a copy of the form.
      Click here to view the scored probe.

      Scored probe

      Adventure_on_Highway_66_revised

      After scoring, click here for feedback.

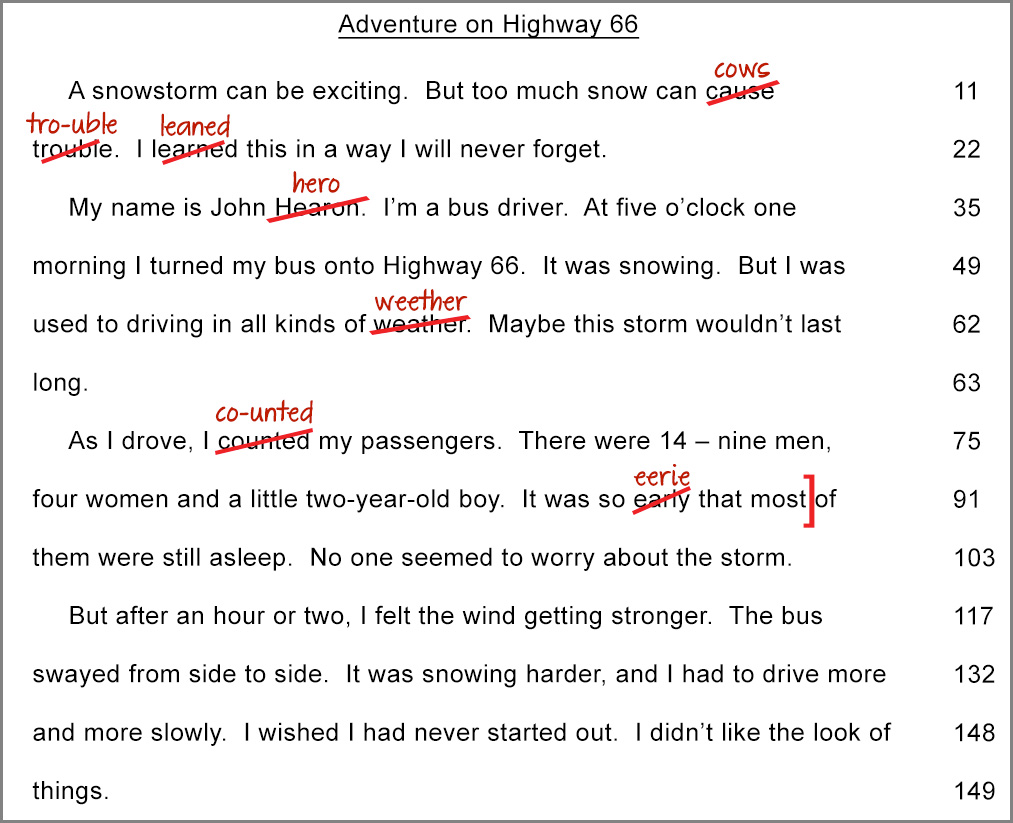
      Error Categories
      Actual Word Student Responses Sight word Beginning sounds Ending sounds Short vowels Long vowels Silent e rule Vowel teams Consonant blends Other
      cause cow     X       X    
      trouble tro-uble             X    
      learned leaned                 X
      Hearon hero     X            
      weather weether             X    
      counted co-unted             X    
      early eerie     X       X    


      Created by the Iowa Department of Education and made available by Doing What Works. Used under a Creative Common License.

      (Close this panel)

    4. Based on the information on the error analysis form, what type of errors is Noah typically making?
Print Friendly, PDF & Email
Back Next
Join Our E-Newsletter Sign Up
  • Home
  • About IRIS
  • Our Values
  • Sitemap
  • Web Accessibility
  • Glossary
  • Terms of Use
  • Contact Us
Join Our E-Newsletter Sign Up

The IRIS Center Peabody College Vanderbilt University Nashville, TN 37203 [email protected] The IRIS Center is funded through a cooperative agreement with the U.S. Department of Education, Office of Special Education Programs (OSEP) Grant #H325E220001. The contents of this Website do not necessarily represent the policy of the U.S. Department of Education, and you should not assume endorsement by the Federal Government. Project Officer, Sarah Allen.

Copyright 2023 Vanderbilt University. All rights reserved.

* For refund and privacy policy information visit our Help & Support page.

Creative Commons License This work is licensed under a Creative Commons Attribution-NonCommercial-NoDerivatives 4.0 International License.

  • Vanderbilt Peabody College