How can school personnel use data to make instructional decisions?
Page 9: Making Data-Based Instructional Decisions for Mathematics
 The module Intensive Intervention (Part 1): Using Data-Based Individualization To Intensify Instruction introduces Cole, a second-grade student who has persistent difficulties in mathematics. Although Cole seems to have a good understanding of basic mathematics facts, he has difficulty with subtracting multi-digit numbers. Therefore, he received targeted instruction (Tier 2 instruction):
- In a small group of 4 children
- In a heterogeneous group
- For 2 times per week
- For 15 minutes per session
- For 8 weeks
- Using a validated mathematics program
After eight weeks of targeted instruction, Cole’s weekly progress monitoring data indicate that he is not making adequate progress. Consequently, the student support team decides it is time to implement DBI.
Keep in Mind
Some of the information on this page mirrors that provided on the “Making Instructional Decisions for Mathematics” page of the IRIS Module Intensive Intervention (Part 1): Using Data-Based Individualization To Intensify Instruction, which focuses on Steps 1 and 4 of the DBI process.
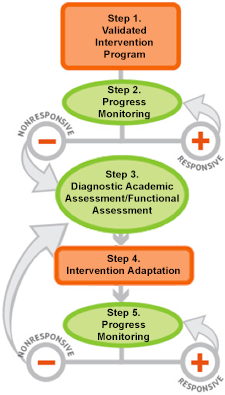 Begin the DBI Process
Step 1: Validated Intervention Program
The student support team decides to make quantitative changes to the validated program used during targeted instruction and to implement it for six weeks. The adapted intervention will be delivered:
- In a small group of 3 students
- In a homogenous group (i.e., students with similar learning needs)
- For 3 times per week
- For 20 minutes per session
Step 2: Progress Monitoring
After making these quantitative changes, Cole’s teacher continues to monitor his progress. After five weeks of intervention and data collection, the teacher evaluates Cole’s performance.
Activity
Use Cole’s progress monitoring data to make a data-based decision.
-
Plot Cole’s progress monitoring data on the graph included here. Refer to the five weeks of data specified below, and for each one click the correct point on Cole’s graph to determine whether he is making progress with the current instructional adaptations.
- Week 9 — 17 problems correct
- Week 10 — 18 problems correct
- Week 11 — 18 problems correct
- Week 12 — 19 problems correct
- Week 13 — 20 problems correct
That’s not the correct point for week 9.To start, plot the point for week 9. -
Review the data in the graph. What do these data indicate about Cole’s progress?
Click the correct response below.
- Cole is making adequate progress.
- Cole is not making adequate progress.
- There is not enough data to make an informed decision.
“Cole is making adequate progress” is incorrect.
“Cole is not making adequate progress” is correct.
“There is not enough data to make an informed decision” is incorrect.
Step 3: Diagnostic Assessment
Because Cole is not making sufficient progress, the teacher conducts an informal diagnostic assessment that primarily consists of an error analysis of one of his worksheets (demonstrated on Perspectives & Resources Page 7). Click here to review the worksheet that Cole’s teacher used to perform an error analysis. The table below analyzes the first three problems he answered incorrectly. An analysis of Cole’s errors indicate that he is having difficulty with subtraction: He subtracts the lesser number from the greater number, regardless of whether the lesser number is on the top (minuend) or the bottom (subtrahend).
| Problems Analyzed from Cole’s Worksheet | ||
|---|---|---|
| Problem Number | Problem | Error |
| Problem 2 |  |
In the one’s column, Cole subtracted 7 from 9, instead of subtracting 9 from 7. Because he didn’t regroup, the 10’s column digit is also incorrect. |
| Problem 6 |  |
In the ten’s column, Cole subtracted 5 from 8, instead of 8 from 5. Because he didn’t regroup, the 100’s column digit is also incorrect. |
| Problem 7 |  |
In the ten’s column, Cole subtracted 0 from 9 instead of 9 from 0. Because he didn’t regroup, the 100’s column digit is also incorrect. |
Activity: Step 3
Cole’s first three errors indicate that he subtracts the lesser number from the greater number, regardless of whether the lesser number is on the top (minuend) or the bottom (subtrahend).
-
The remaining problems Cole answered incorrectly on the worksheet have been recorded in the table below. For each incorrect problem, describe the error he made in the third column .
Problems Analyzed from Cole’s Worksheet Problem Number Problem Error Problem 8 
Problem 12 
Problem 17 
Problem 18 
Problem 19 
Problem 20 
Problem 21 
Problem 23 
-
Analyze the errors that Cole is making and determine whether he is consistently making the same type of error as he did in the first three incorrect problems or whether he is making other types of errors.
Problems Analyzed from Cole’s Worksheet Problem Number Problem Error Problem 8 In the one’s column, Cole subtracted 6 from 9 instead of 9 from 6. Because he didn’t regroup, the 10’s and 100’s column digits are also incorrect.
Problem 12 In the one’s column, Cole subtracted 3 from 9 instead of 9 from 3. Because he didn’t regroup, the 10’s and 100’s column digits are also incorrect. Cole also continues to subtract the lesser number from the greater number in the 10’s column.
Problem 17 In the ten’s column, Cole subtracted 0 from 9 instead of 9 from 0. Because he didn’t regroup, the 100’s column digit is also incorrect.
Problem 18 In the ten’s column, Cole subtracted 1 from 8 instead of 8 from 1.
Problem 19 In the one’s column, Cole subtracted 3 from 6 instead of 6 from 3. Because he didn’t regroup, the 10’s column digit is also incorrect.
Problem 20 Although Cole got the correct number for the one’s column, it appears as though he didn’t regroup. (In this case, 7 – 2 and 12 – 7 both equal 5). Because he didn’t regroup, the 10’s column digit is also incorrect.
Problem 21 In the one’s column, Cole subtracted 1 from 5 instead of 5 from 1. Because he didn’t regroup, the 10’s and 100’s column digits are also incorrect. Cole also continues to subtract the lesser number from the greater number in the 10’s column.
Problem 23 In the ten’s column, Cole subtracted 6 from 9 instead of 9 from 6. Because he didn’t regroup, the 100’s column digit is also incorrect.
Cole is consistently making the same type of error as he did in the first three incorrect problems. He subtracts the lesser number from the greater number, regardless of whether the lesser number is on the top (minuend) or the bottom (subtrahend).
Step 4: Instructional Adaptation
The student support team reconvened to examine Cole’s progress monitoring and diagnostic assessment data to make a decision regarding instructional adaptations that will likely help Cole make adequate progress. Because his progress monitoring scores are approaching the goal line, the team believes that more focused instruction on his specific skill deficit will be more beneficial than increasing the amount of intervention he receives. Cole’s support team recommends the following qualitative instructional adaptations:
- Explicit instruction on regrouping
- Self-instruction
Step 5: Progress Monitoring
Progress monitoring data were collected for another six weeks. The data indicate that Cole is making adequate progress and will meet his end-of-year goals. Because of this, the student support team decides to continue implementing the current intervention and monitor his progress.

Step 5: Progress Monitoring (Cole’s Data)
This graph displays Cole’s progress monitoring data over a span of nineteen weeks, which here form the x-axis and which is divided by a vertical blue dotted line after week eight and a half. The left side of this line is labeled “Tier 2,” whereas the section after the line is labeled “Quantitative Changes.” At week thirteen and a half, another vertical dotted line divides the graph. From that point until week 19, the graph is labeled “Quantitative and Qualitative Changes.”
The y-axis is labeled “Number Correct” and is divided into five-point increments from 0 to 35. Cole’s goal line is represented by a red line that begins just below 15 correct responses and ends at 20 correct responses.
Cole’s actual correct responses are represented by a blue line that indicates the following numbers: 10, 11, 13, 10, 14, 15, 13, 15, 16, 17, 17, 19, 20, 21, 22, 24, 25, 27, and 29. At all points, Cole’s progress is beneath his goal line.
Keep in Mind
Although Cole is making progress with the current intervention, some students with severe and persistent learning difficulties might need to repeat the last three steps of the DBI process (i.e., diagnostic assessment, intervention adaptation, progress monitoring) multiple times to reach the level of intensity and individualization required for the student to make adequate progress.
![]()
Summary
Although Cole has learned how to regroup when subtracting a greater from a lesser number, his teacher must continue to collect progress monitoring data to assess his performance on an ongoing basis. By collecting data, the teacher can make sure that Cole continues to apply this skill consistently and that Cole is not struggling with other skills.