How can school personnel use data to make instructional decisions?
Page 3: Progress Monitoring
Recall that Step 2 and Step 5 of the DBI process involve progress monitoring—one of the best ways to measure a student’s response to instruction. The progress monitoring approach used most often in the DBI process is known as general outcome measurement (GOM). GOM is a type of formative assessment in which multiple related skills are measured on a regular basis to assess a student’s performance on those skills across time.
General outcome measures are:
- Easy to implement
- Quick to administer
- Cost-effective
- Designed to be administered frequently (e.g., once per week)
- Sensitive to change in student performance
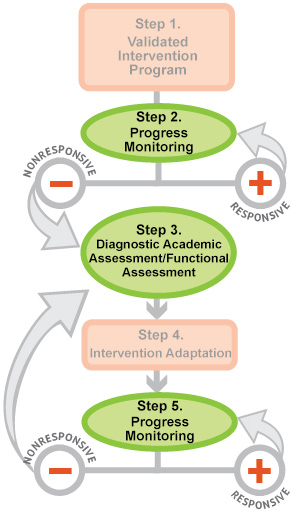
This graphic illustrates both the steps of data-based individualization, as well as they ways in which those steps interact. Step 1, “Validated Intervention Program,” is represented by an orange rectangle. This box connects via a vertical grey line to Step 2, “Progress Monitoring,” which is illustrated as a green oval. Both steps, in turn, are connected to a horizontal line with labeled circles at each of its ends. The circle on the left, “Nonresponsive,” has a red minus sign at its center, while the circle on the right, “Responsive,” has a red plus sign. A grey arrow connected to the “Nonresponsive” circle points toward Step 3 of the DBI process, “Diagnostic Academic Assessment/Functional Assessment,” which is represented as a green oval, similar to Step 2. The “Responsive” circle also has a grey arrow, this one pointing back up toward Step 2, “Progress Monitoring.”
Step 3 is connected via a vertical grey arrow to Step 4, “Intervention Adaptation,” represented as an orange rectangle. Another grey arrow connects Step 4 to Step 5, “Progress Monitoring,” another green oval. As above, these latter steps are connected to a horizontal line with labeled circles at each of its ends. The circle on the left, “Nonresponsive,” has a red minus sign at its center, while the circle on the right, “Responsive,” has a red plus sign. A large grey arrow connected to the “Nonresponsive” circle points back to Step 3, “Diagnostic Academic Assessment/Functional Assessment,” while the “Responsive” circle directs instructors back to Step 5, “Progress Monitoring.”
This module page focuses on Steps 2, 3, and 5, so those green ovals are highlighted whereas the rest of the graphic is slightly faded out.
The first step in progress monitoring is to identify a measure to assess the skills targeted by the intervention. The type of progress monitoring measure a teacher uses will depend on the student’s instructional level rather than his or her grade level. For example, a third-grade student reading at a third-grade instructional level might be administered a passage reading fluency measure (or probe). However, a third-grade student reading at a first-grade level might be administered a word identification fluency probe.
For Your Information
- For students with severe and persistent learning difficulties, progress monitoring data should be collected at least once a week, and more often if feasible.
- One common type of GOM is curriculum-based measurement (CBM), a type of progress monitoring conducted on a regular basis to assess a student’s performance throughout an entire year’s curriculum.
- The National Center on Intensive Intervention offers a wealth of information about progress monitoring tools. Click on each of the links below to access some of these resources:
- Academic Progress Monitoring Tools Chart. This chart provides a variety of information about a wide range of progress monitoring measures. Some sources offer non-English language versions of the measures for linguistically diverse students and large-print versions for those with visual disabilities.
- Progress Monitoring Handouts. This document contains information about reading and mathematics probes, including administration scripts and teacher scoring sheets.
Once the teacher has identified a progress monitoring measure, he or she is ready to begin evaluating the student’s performance. The steps below describe how to do this.
- Collect baseline data: Determine each individual’s current level of performance, or baseline, for the targeted skill (e.g., reading fluency). If the student has been receiving Tier 2 instruction, the teacher can use the last three data points as a baseline. If not, the teacher can get a reliable estimate of a student’s level of performance by administering three probes within a week or so.
- Identify the goal: Determine the level of performance that the student should reach by the end of the intervention period. This goal, or benchmark, is often indicated in the information that accompanies a progress monitoring measure (e.g., word identification fluency: the benchmark is 40 words correct per minute by the end of first grade). Alternatively, the school team can determine an appropriate end-of-year goal for an individual student.
x
benchmark
glossary
-
Create a graph: Use the commercially available progress monitoring graphing software that accompanies the progress monitoring measure or develop a teacher-made graph. The horizontal axis represents the number of weeks of instruction. The vertical axis represents the range of possible scores a child or student can obtain on the probe. After plotting the student’s baseline data (i.e., scores on three consecutive probes) on the graph, draw a goal line between the median of these scores and the goal.
Drawing the Goal Line
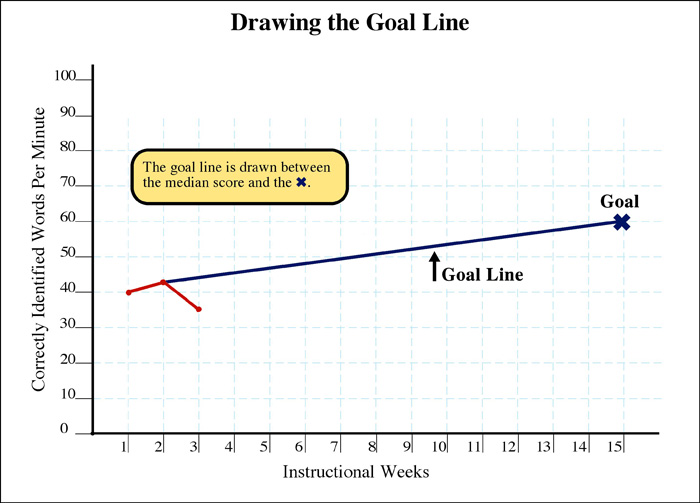
This graphic represents an example of a student’s goal line. A span of 15 “Instructional Weeks” forms the x-axis and is divided into one-week intervals. The y-axis is labeled “Correctly Identified Words Per Minute” and is divided ten-word increments from 0 to 100.
The goal is represented here by a blue line. The line begins at Week 1 at the 40 correct responses mark and rises slightly through the weeks until it terminates at the 60 correct responses line in Week 15. The end of the line is marked with an X and is labeled “Goal.” A yellow textbox reads “The goal line is drawn between the median score and the X.”
A short data line is included here, as well. It is represented as a red line. It begins in Week 1 at the 40 correct responses line, rises to 41 correct responses in Week 2, then falls to 37 correct responses in Week 3.
xgoal line
glossary
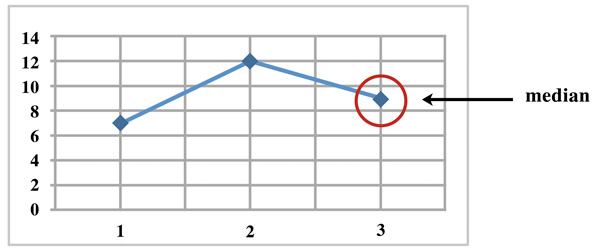
xmedian
The middle value found by ordering scores from lowest to highest. For example, to determine the median of the numbers 7, 12, and 9, you would first put them in order (i.e., 7,9,12). The number in the middle (i.e., 9) is the median.
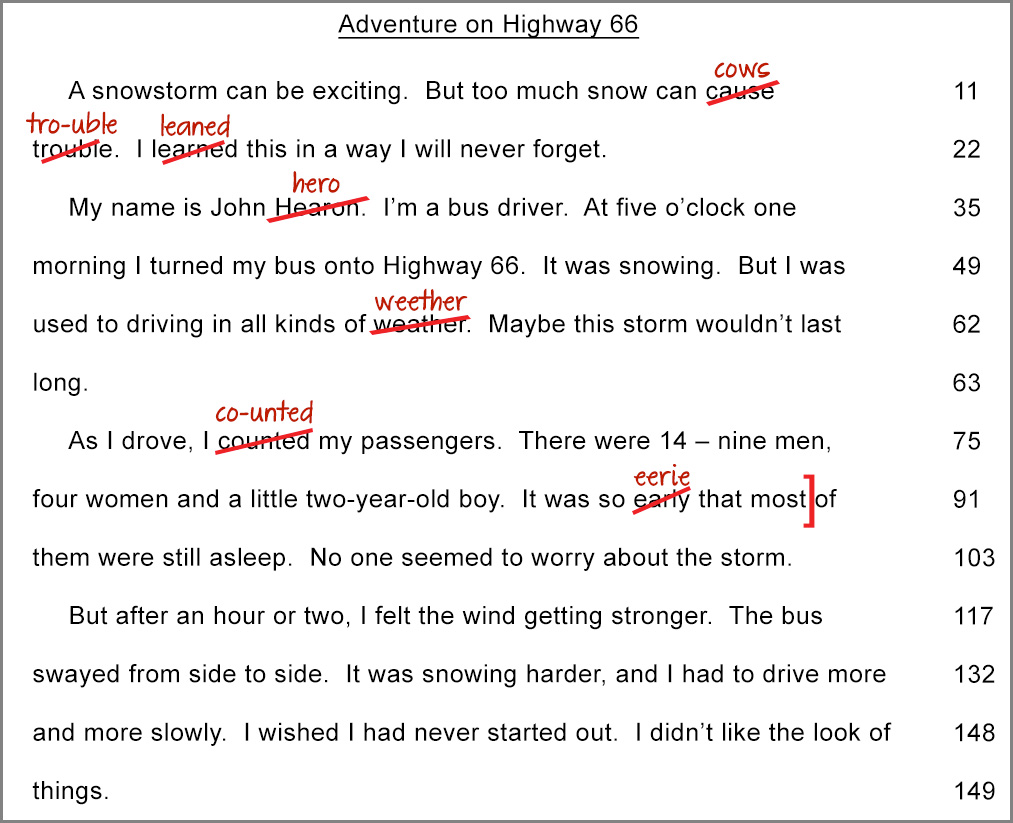
- Administer and score probes: Administer and score the probes at regular intervals (e.g., weekly, bi-weekly). In general, they can be administered quickly (e.g., maze fluency: up to 2.5 minutes; math concepts: up to 10 minutes).
To score this passage, the teacher records any errors the student makes (e.g., misread words, omitted words, or added words). She calculates the number of words read correctly in one minute by subtracting the errors from the total number of words read. She uses the numbers at the end of each line in the passage to help. For example, Natalia made eleven mistakes. The last word she read was “boy.” The teacher looks at the line before the last word. There are 75 words. She then counts the number of words in the next line, 76, 77, 78, 79, 80, 81, 82, 83, 84. So Natalia read a total of 84 words. The teacher subtracts 11 from the total number of 84, which is a score of 73 words read correctly in one minute.
- Graph scores: Every time a probe is administered, record the score on the graph and draw a line to connect it to the previous data point. Alternately, allow the student to graph the data: Research shows that students who do so are more aware of their performance and view themselves as more responsible for their learning.

The graph below shows Natalia’s progress monitoring data (Step 2). Note that a vertical, dashed line separates the baseline data from the progress monitoring data. Also note that there is no line connecting the baseline data points to the progress monitoring data points.
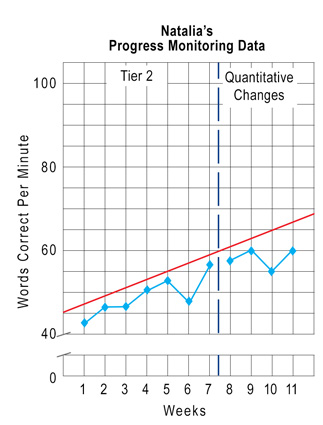
Step 2: Progress Monitoring (Natalia’s Data)
This graph displays Natalia’s progress monitoring data over a span of eleven weeks, which here form the x-axis and which is divided by a vertical blue dotted line after Week 7. The left side of this line is labeled “Tier 2,” whereas the section after the line is labeled “Quantitative Changes.” The y-axis is labeled “Words Correct Per Minute” and is divided into five word increments with a gap between 0 and 40 where there is no data.
Natalia’s goal line is represented by a red line that runs through 42 words per minute for Week 1 and 67 words per minute for Week 11.Natalia’s actual correct words per minute are represented by a blue line that indicates the following numbers: Week 1—43 words per minute, Week 2—46 words per minute, Week 3—46 words per minute, Week 4—51 words per minute, Week 5—53 words per minute, Week 6—48 words per minute, Week 7—57 words per minute, Week 8—58 words per minute, Week 9—60 words per minute, Week 10—55 words per minute, Week 11—60 words per minute. At all points, Natalia progress is beneath her goal line.
Listen as Devin Kearns discusses the importance of collecting baseline data and of administering general outcome measures (time: 2:19).
Transcript: Devin Kearns, PhD
Narrator: Why do you start progress monitoring before you begin an intervention and what do you need to consider when selecting a progress monitoring measure to ensure you get the data you need to make decisions?
Devin Kearns: If you have a student who you’ve identified as potentially in need of intensive intervention, it’s essential to begin progress monitoring them on a weekly basis right away, even if you haven’t started your interventions, even if the team is not sure what they’re going to do. The reason is that you want to collect a lot of baseline data, which is to say the data you have before you actually make a decision about what to do, because that will allow you then to create an aim line to determine the rate of growth that a student is going to need in order to make adequate progress. If you don’t have baseline data, you can’t tell what’s a good estimate of the student’s current rate of performance and how much we should increase that. So it’s really critical to begin doing weekly progress monitoring as soon as you can.
One thing that’s important to state along with that is that there are two forms of progress monitoring, as you may know. One is mastery measurement, and one is general outcome measurement. And for reading and math in particular, it’s really important to do the general outcome measure at the student’s instructional level. So if you have a fourth-grade student who’s performing at a second-grade level in reading, you are going to use second-grade progress monitoring tools, and you’re going to administer those on a weekly basis to collect your baseline data. And it’s important to have this general outcome measure because if you just do, like, say a sight word measure, that is great, but you do not know enough about the student’s broader reading. You only know about one thing. So, again, it’s really important to begin the measurement right away as soon as you’re beginning to feel the student might be a student you are going to include in intensive intervention and might need data-based individualization even if you haven’t started yet.