How can school personnel use data to make instructional decisions?
Page 8: Making Data-Based Instructional Decisions for Reading
 Recall from the Challenge that Natalia is a fourth-grade student who has serious reading problems, especially with decoding and fluency. She is currently reading at an early second-grade level. Natalia received targeted instruction:
- In a small group of 5 children
- In a heterogeneous group
- For 3 times per week
- For 20 minutes per session
- For 7 weeks
- Using a validated program that addressed phonological awareness, word study, and fluency skills
After seven weeks of targeted instruction, Natalia’s weekly progress monitoring data indicate that she is not making adequate progress. Consequently, the intervention team decides it is time to implement DBI.
Keep in Mind
Some of the information on this page mirrors that provided on the Making Instructional Decisions for Reading page of the IRIS Module Intensive Intervention (Part 1): Using Data-Based Individualization To Intensify Instruction, which focuses on Steps 1 and 4 of the DBI process.
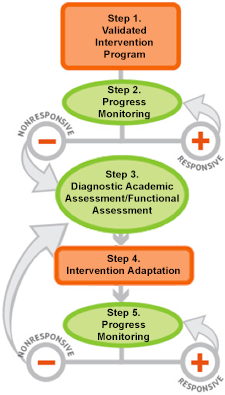 Begin the DBI Process
Step 1: Validated Intervention Program
The intervention team at Natalia’s school decides to make quantitative changes to the validated program used during targeted instruction and to implement it for four weeks. The adapted intervention will be delivered:
- In a small group of 3 students
- In a homogenous group
- For 4 times per week
- For 30 minutes per session
Step 2: Progress Monitoring
After making these quantitative changes, Natalia’s teacher continues to monitor her progress (Step 2). After four weeks of intervention and data collection, the teacher evaluates Natalia’s performance.
Activity
Review the data in the graph to the right. What do the data in the section of the graph labeled Quantitative Changes indicate about Natalia’s performance?
Click the correct response below.
Natalia is making adequate progress.
Natalia is not making adequate progress.
There is not enough data to make an informed decision.
Natalia is making adequate progress.
Incorrect: The four data points are below the goal line, indicating that Natalia is not making progress and might need additional intervention adaptations to support her learning needs.
Natalia is not making adequate progress.
Correct: The four data points are below the goal line, indicating that Natalia is not making progress and might need additional intervention adaptations to support her learning needs.
There is not enough data to make an informed decision.
Incorrect: The four data points are below the goal line, indicating that Natalia is not making progress and might need additional intervention adaptations to support her learning needs.

Activity (Natalia’s Progress Monitoring Data)
This graph displays Natalia’s progress monitoring data over a span of eleven weeks, which here form the x-axis and which is divided by a vertical blue dotted line after Week 7. The left side of this line is labeled “Tier 2,” whereas the section after the line is labeled “Quantitative Changes.” The y-axis is labeled “Words Correct Per Minute” and is divided into five word increments with a gap between 0 and 40 where there is no data.
Natalia’s goal line is represented by a red line that runs through 42 words per minute for Week 1 and 67 words per minute for Week 11.Natalia’s actual correct words per minute are represented by a blue line that indicates the following numbers: Week 1—43 words per minute, Week 2—46 words per minute, Week 3—46 words per minute, Week 4—51 words per minute, Week 5—53 words per minute, Week 6—48 words per minute, Week 7—57 words per minute, Week 8—58 words per minute, Week 9—60 words per minute, Week 10—55 words per minute, Week 11—60 words per minute. At all points, Natalia progress is beneath her goal line.
Step 3: Diagnostic Assessment
Because Natalia is not making progress with the latest adaptations to the validated intervention program, her teacher conducts an informal diagnostic assessment. Informal diagnostic assessments help determine what specific skills the student is struggling with.
- First, the teacher conducted a reading error analysis (demonstrated on Perspectives & Resources Page 6). Click here to review Natalia’s completed error analysis table. Recall that her errors were mostly word endings.
Natalia’s completed Error Analysis Table
Error Categories Actual word Student responses 


snowstorm snowman X trouble problems X never not X morning Monday X turned took X weather winter X Maybe Many X storm snow X counted colored X passengers passing X boy baby X (Close this panel)
- As part of the diagnostic assessment, Natalia’s teacher administered a phonics inventory. The data indicated that Natalia applied decoding strategies to one-syllable nonsense words, but when she encountered multisyllabic words, she guessed at the word based on the beginning letters.
Step 4: Instructional Adaptation
Using the informal diagnostic assessment results, the intervention team determines that Natalia should work on decoding multisyllabic words and fluency and believes that she might improve this skill through:
- Increased instruction from 30 to 45 minutes/session
- More explicit instruction
- More opportunities to practice
Step 5: Progress Monitoring
Progress monitoring data were collected for six weeks. The data indicate that Natalia is making some progress, but not enough to meet her end-of-year goal (see the graph below).

Because Natalia has gone through the DBI process and has not made adequate progress, the intervention team decides to repeat Steps 3–5. This does not mean that they simply go through the steps a second time. Rather, they collect additional data and use this information to make further adaptations to Natalia’s instruction in order to improve her reading skills.
Keep in Mind
Recall that when working with students with severe and persistent learning difficulties, like Natalia, teachers might need to implement the last three steps of the DBI process (i.e., diagnostic assessment, intervention adaptation, progress monitoring) multiple times to reach the level of intensity and individualization required for the student to make adequate progress.
![]()
Let’s take a quick look at Natalia’s progress as her teacher repeats Steps 3 through 5 of the DBI process.
Step 3: Diagnostic Assessment
The teacher conducts another informal diagnostic assessment. These data indicate that Natalia is:
- Making fewer decoding errors
- Applying decoding strategies to multisyllabic words but she is failing to use the strategy consistently
- Reading more accurately
Step 4: Instructional Adaptation
Based on the informal diagnostic assessment data, the intervention believes that in addition to the adaptations she made earlier (i.e., 45 minutes/session, more explicit instruction, more opportunities to practice), Natalia might benefit from self-regulation strategies. The intervention team believes that by learning self-regulation strategies, Natalia might be better able to apply decoding strategies more consistently. Thus, the teacher adds self-regulation strategies to Natalia’s intervention.
Step 5: Progress Monitoring
Progress monitoring data were collected for another six weeks. The data indicate that Natalia is now on track to meet her end-of-year goal. For this reason, the teacher will continue to implement these adaptations and monitor her progress.

Step 5: Progress Monitoring (Natalia’s Data)
This graph displays Natalia’s progress monitoring data over a span of twenty-eight weeks, which here form the x-axis and which is divided by a vertical blue dotted line after Week 7. The left side of this line is labeled “Tier 2,” whereas the section after the line is labeled “Quantitative Changes.” At Week eleven and a half, another vertical dotted line divides the graph. From that point until Week 17, the graph is labeled “Quantitative and Qualitative Changes.” After Week 17, the graph is divided by a final blue line and labeled “Qualitative Changes.”
The y-axis is labeled “Words Correct Per Minute” and is divided into twenty word increments with a gap between 0 and 40 where there is no data. Natalia’s goal line is represented by a red line that begins at 40 words per minute and ends at 100 words per minute.
Natalia’s actual correct words per minute are represented by a blue line that indicates the following numbers: just above 40 words per minute, just above 45 words per minute, just above 45 words per minute, 50 words per minute, just above 50 words per minute, just below 50 words per minute, just above 55 words per minute, just below 60 words per minute, 60 words per minute, 55 words per minute, 60 words per minute, 60 words per minute, just above 65 words per minute, just below 70 words per minute, 70 words per minute, 70 words per minute, 75 words per minute, and 77 words per minute. At this point, for the first time, Natalia’s data line goes above her goal line. These numbers are 85 words per minute, 87 words per minute, 90 words per minute, 98 words per minute, and 98 words per minute.
Summary
By the end of the school year, Natalia is showing marked improvement in reading. Although the interventions that the teacher is currently using are effective for Natalia, the teacher will still need to collect progress monitoring data to assess her performance on an ongoing basis. The intervention that is effective now might not be what Natalia needs in the coming months. By collecting and reviewing data, the teacher can make informed instructional decisions, which in turn will allow Natalia to experience continued success.