How can school personnel use data to make instructional decisions?
Page 4: Analyzing Progress Monitoring Data
After making adaptations to an intervention, the teacher needs to collect and analyze progress monitoring data to determine how the student is responding to the intervention. To obtain a reliable estimate, he or she must collect data for a minimum of six weeks (or six data points if data are collected more than once per week). After graphing the data, the teacher can evaluate the student’s performance using the Four-Point Method, an easy method for examining the relationship between the four most recent data points and the goal line. The figures below illustrate how a teacher can interpret the information from the student’s graph using the Four-Point Method.
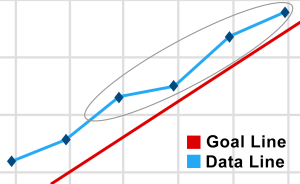 |
If most of the four most recent data points are on or above the goal line, the student is demonstrating improved outcomes. The teacher should continue with the current instructional program. |
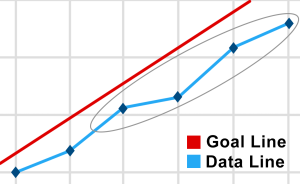 |
If most of the four most recent data points are below the goal line and data indicate that the child or student will not meet the benchmark, performance is not improving. It is time for the teacher to make an instructional change. |
For Your Information
Another way a teacher can evaluate the student’s performance is to use trend line analysis. Although this method is more reliable for evaluating a student’s performance, it requires more time and expertise. Click here to learn more about this process.
Listen as Sarah Arden discusses how long a teacher should implement an intervention before deciding whether or not the student is making adequate progress (time: 0:51).
Sarah Arden, PhD
Technical Assistance Team,
National Center on Intensive Intervention

Transcript: Sarah Arden, PhD
So research tells us that intervention should be implemented for about six to eight weeks for younger students. Research tells us that for older students—middle school, high school students—sometimes they need longer to show that they’re making progress, so maybe even up to twelve weeks you can keep them in intervention. However, during those intervention periods progress should always be monitored, and if you know for sure that something just really isn’t working or it’s going really poorly we always say to make instructional adaptations and changes. But you have to give students a little bit of time to get in there, and what I mean by that is that they have to be receiving intervention with fidelity, it has to be valid, and it needs to be reliable. So at least six to eight weeks of valid reliable intervention happening with fidelity before you decide to make any intense changes.
Activity
Review Natalia’s progress monitoring graph below. Using the Four-Point Method, evaluate Natalia’s progress. (Hint: Analyze the data points in the portion of the graph labeled “Quantitative & Qualitative Changes.”)
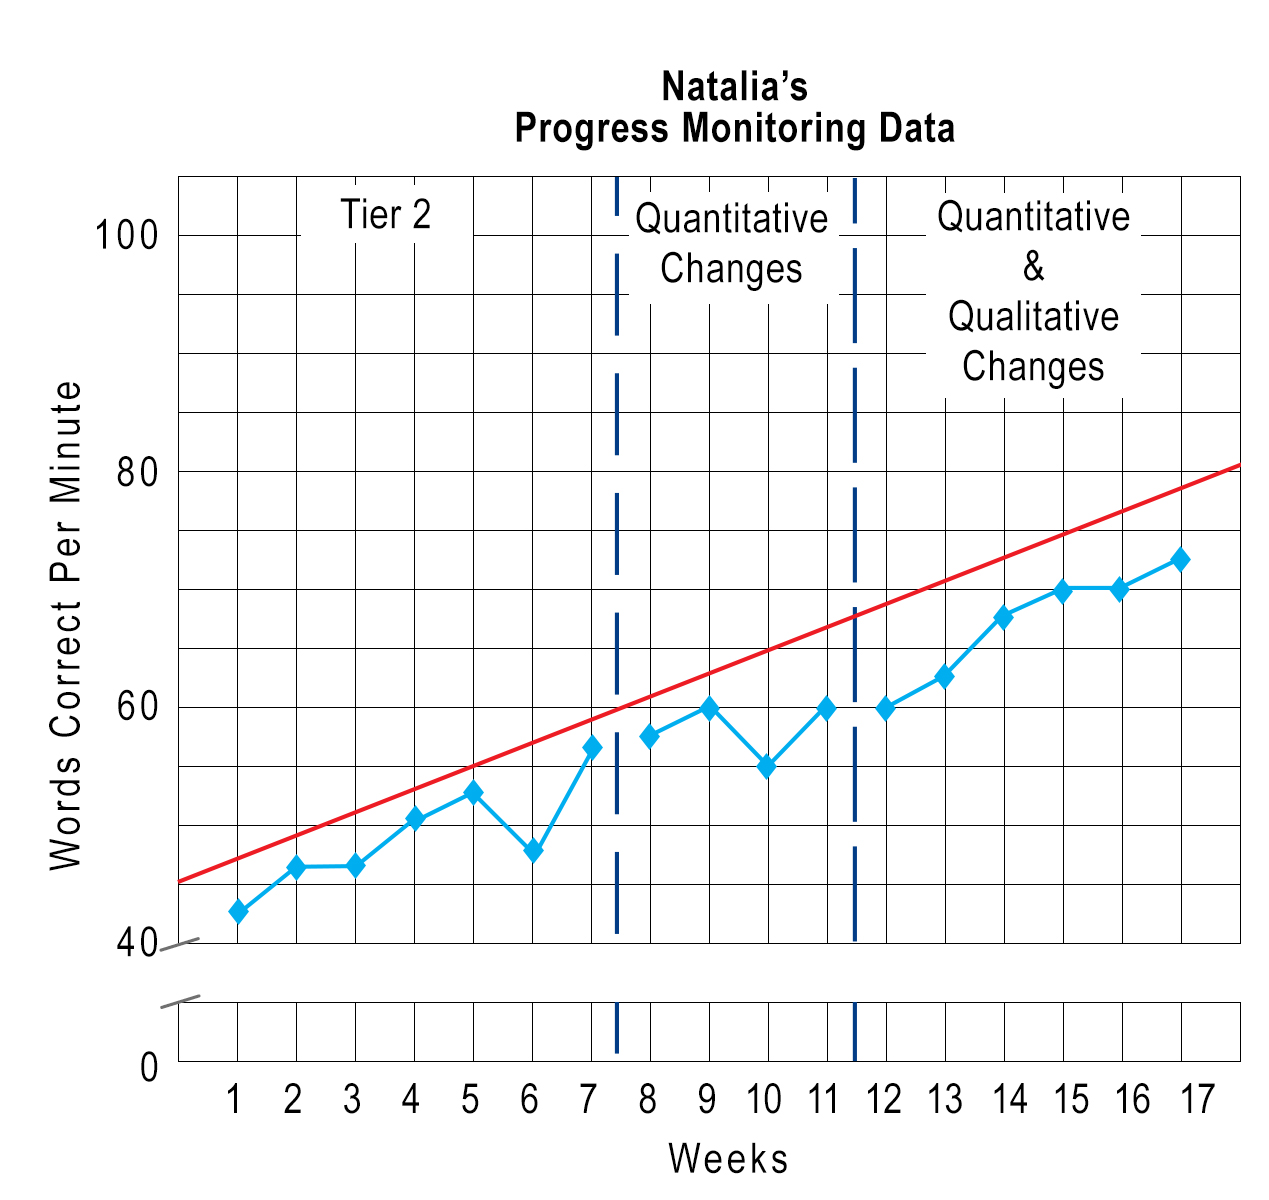
This graph displays Natalia’s progress monitoring data over a span of seventeen weeks, which here form the x-axis and which is divided by a vertical blue dotted line after Week 7. The left side of this line is labeled “Tier 2,” whereas the section after the line is labeled “Quantitative Changes.” At Week eleven and a half, another vertical dotted line divides the graph. From that point until Week 17, the graph is labeled “Quantitative and Qualitative Changes.”
The y-axis is labeled “Words Correct Per Minute” and is divided into five word increments with a gap between 0 and 40 where there is no data. Natalia’s goal line is represented by a red line that runs through 42 words per minute for Week 1 and 78 words per minute for Week 17.
Natalia’s actual correct words per minute are represented by a blue line that indicates the following: Week 1—43 words per minute, Week 2—46 words per minute, Week 3—46 words per minute, Week 4—51 words per minute, Week 5—53 words per minute, Week 6—48 words per minute, Week 7—57 words per minute, Week 8—58 words per minute, Week 9—60 words per minute, Week 10—55 words per minute, Week 11—60 words per minute, Week 12—60 words per minute, Week 13—63 words per minute, Week 14—68 words per minute, Week 15—70 words per minute, Week 16—70 words per minute, and Week 17—73 words per minute. At all points, Natalia progress is beneath her goal line.
Select the answer below that indicates how Natalia is performing.
Incorrect: Most of the four most recent data points are below the goal line. Therefore, the data indicate that Natalia is not improving.
Correct: Most of the four most recent data points are below the goal line. Therefore, the data indicate that Natalia is not improving.